InterWell 2019.1

InterWell是法国石油研究院基于OpenFlow平台推出的最新Windows版本反演软件,软件具有全面的叠前、叠后地震反演功能,技术方法先进,在薄互层反演、子波分析、道集校正等领域具有独特的技术。

软件反演方法完善,应用领域广泛,包括常规波阻抗反演、各向异性反演、GSI地质统计学反演等。

通过利用地质、测井和地震信息为波阻抗反演、弹性参数反演和4D联合反演提供独特的工作平台。

软件具有严格的QC控制,开放的工作平台,经过多次实践运用,能够全面精准的完成储层预测与评价工作。

子波校正技术为InterWell软件的特色技术。大家都知道,地震子波是反演运算的关键因素,InterWell反演软件从时移、相位、能量三个方面出发,对子波进行校正和归位,最大程度提高井震匹配相关度,保证地震子波的精度,使反演结果更加真实的反映地下岩性特征。

发表在 正演反演软件 | 标签为 , , , | InterWell 2019.1已关闭评论

tNavigator 2020.1

发表在 数值模拟软件 | 标签为 , , , | tNavigator 2020.1已关闭评论

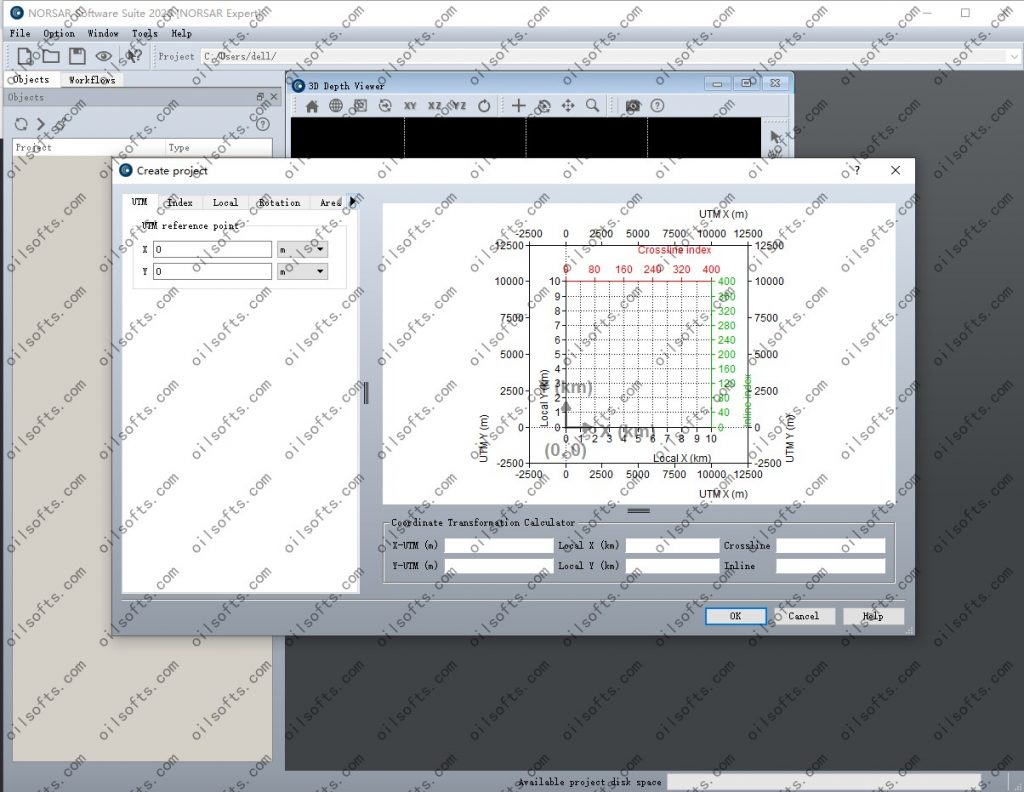
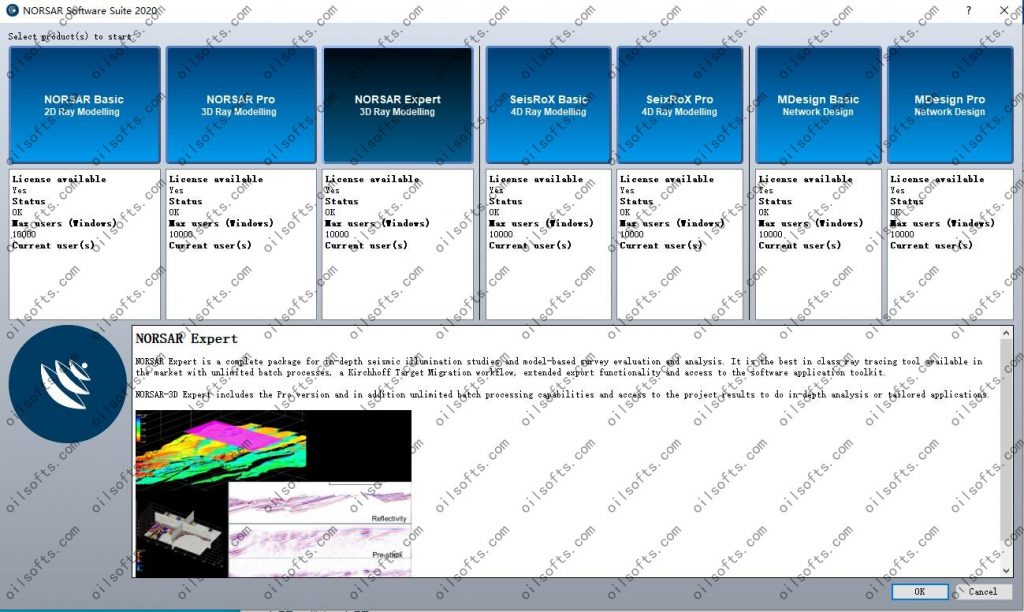
norsar 2020

norsar 2019 seisrox 2019 MDesign 2019

发表在 正演反演软件 | 标签为 , , | norsar 2020已关闭评论

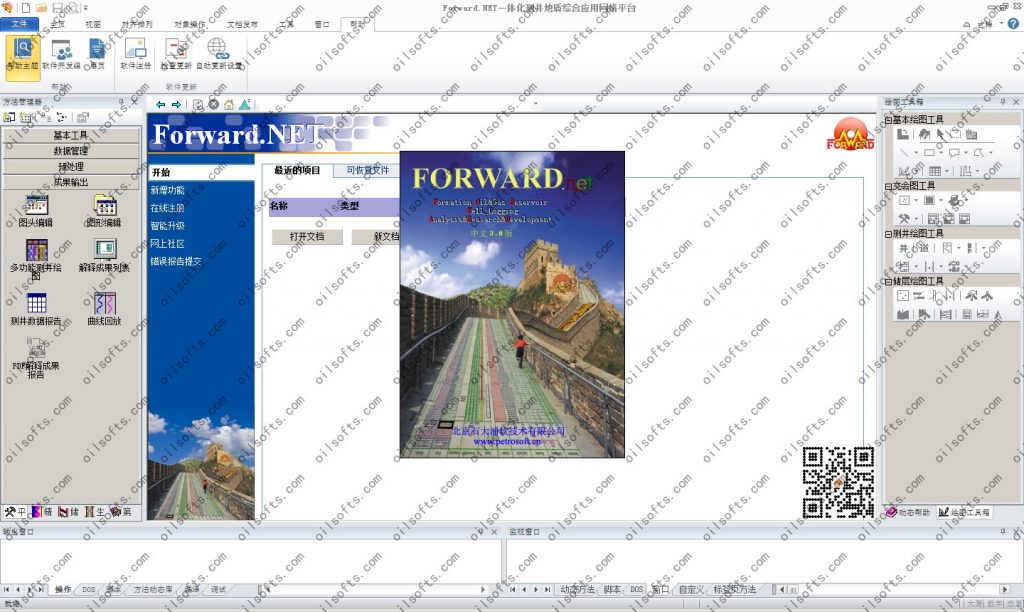
forward.net 3.0

发表在 钻井测井软件 | 标签为 , , | forward.net 3.0已关闭评论

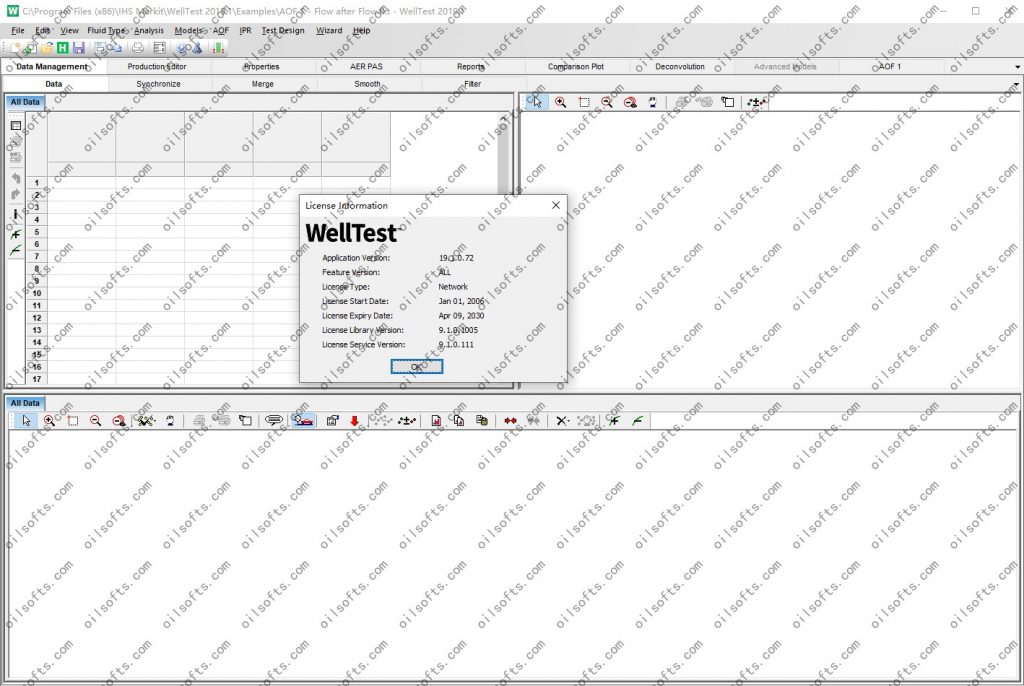
IHS welltest 2019

F.A.S.T WellTest是一套到目前为止,基于实时数据采集系统之上,界面友好,技术先进的压力传导分析软件包。它包含了很多简单的或者全面的油藏模型。这些模型都能够快捷易用的分析获得储层的渗透率、井筒储集系数、表皮系数、排采面积、原始储量和措施效果。另外,根据直线的压力变化可以进行各种模型的产能预测。也可以根据井口的压力数据来获得井底的压力数据,以便进行分析。

发表在 采油试井压裂 | 标签为 , , , | IHS welltest 2019已关闭评论

IHS Harmony 2019

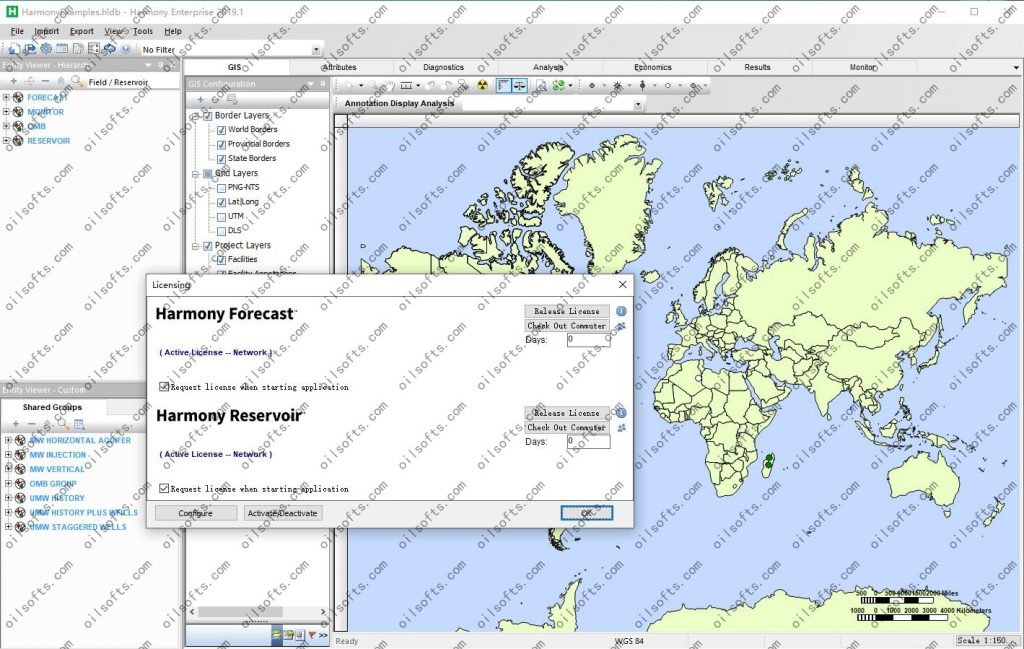
Harmony是用于分析的石油和天然气井的储量性能和评估的全面桌面工程应用。利用我们的全套使用基于地图的界面增强稳健水库工程工具。创建共同的企业工作流程就是充分利用您组织里技术专家和和共享解释来确定最佳的资产发展战略。

Harmony Enterprise™: Well Performance Software

Increase productivity with workflows that leverage a full suite of empirical, analytical and numerical tools

How do your reservoir management and production forecasting tools measure up in today’s environment?

Now available in a single or multi-user platform, Harmony™ from IHS Markit is a comprehensive engineering application for analyzing oil and gas well performance and evaluating reserves. Access a full suite of reservoir and production engineering tools in one interface. Create common corporate workflows that harness your organization’s technical expertise and share interpretations to determine the best asset development strategies.

  • Extract maximum value from well performance data
  • Reduce IT overhead and training efforts by utilizing one integrated software package
  • Create rigorous Typewells (Type Curves) and forecast reserves
  • Monitor well production through customizable diagnostic dashboards
  • Assess reserves risk with probabilistic forecasting
  • Run ‘what If’ scenarios to assess the impact of alternative well spacing, completion design, or artificial lift mechanisms

Harmony Enterprise™ : The new scalable, collaborative multi-user platform suitable for IT environments of all sizes

Engineers, Geoscientists and Analysts are faced with an ever-increasing number of wells to analyze, and often need to collaborate with others so that a confident final interpretation of well performance can be delivered.

  • All analysis work is centralized for better access, consistency and auditing
  • The platform is highly performant with up to 100,000 wells per project
  • No engineering time is spent loading data, seamless data connection to IHS Markit and company data sources
  • Access to the latest technical developments including multiphase probabilistics, refracture modeling and decline autoforecast
发表在 采油试井压裂 | 标签为 , , , | IHS Harmony 2019已关闭评论

The Kingdom Software 2019 smt


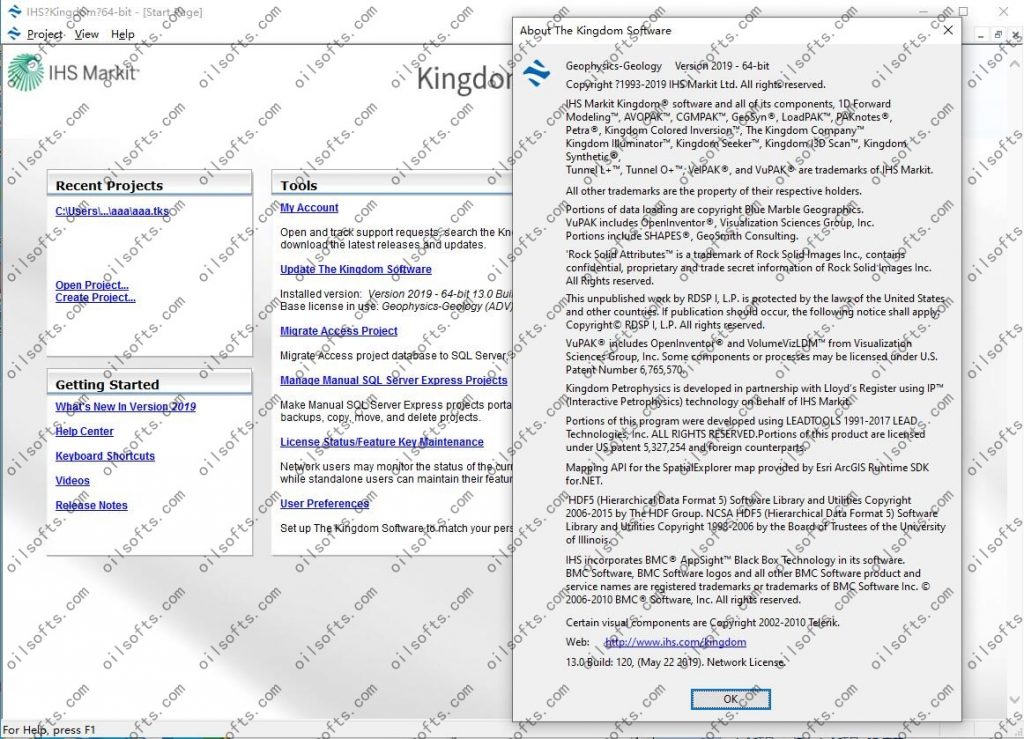
IHS Kingdom Suite 2019是一款功能强大的地震解释软件,提供微震分析、地质导向、地震建模等多项功能,可以简化数据加载,解释和速度建模,减少周期时间和深度转换的过程。为地震行业提供了完整的解决方案。

发表在 地震资料解释软件 | 标签为 , , , | The Kingdom Software 2019 smt已关闭评论

DynaLift

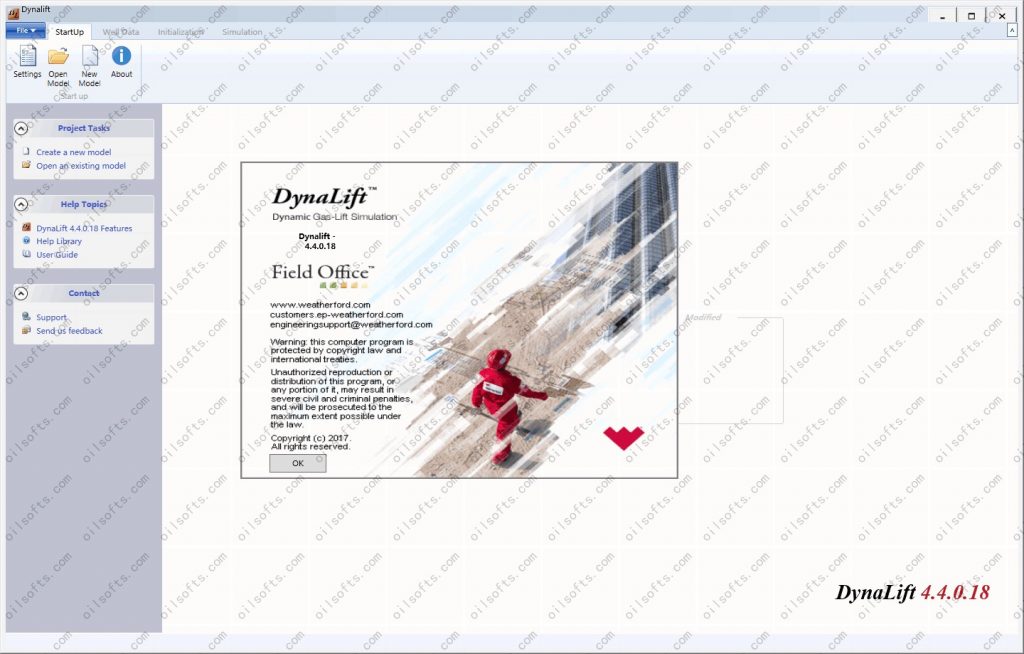
DynaLift is a forward time stepping algorithm that solves for equilibrium at each time step. The model
encompasses every part of a gas lift well from gas injection choke to the separator. All the various
components in a gas lift well are modeled with the best available correlations that are applied rigorously. No
assumptions are made about what is “supposed” to happen.
DynaLift software simulates the dynamic behavior and characteristics of the gas-lift unloading process. It uses
the transient modeling of flow in both the wellbore and the reservoir.
The DynaLift application identifies design and operation issues which result from multi-point injection,
injection through shallower valves and unstable flow conditions. The software is an integral component of the
well engineer’s design and optimization toolkit.

发表在 采油试井压裂 | 标签为 , , , | DynaLift已关闭评论

permedia 5000

Risk Assessment

Reflecting parameter uncertainties and quantifying risk associated with basin and reservoir-scale models is critical to any modeling study.

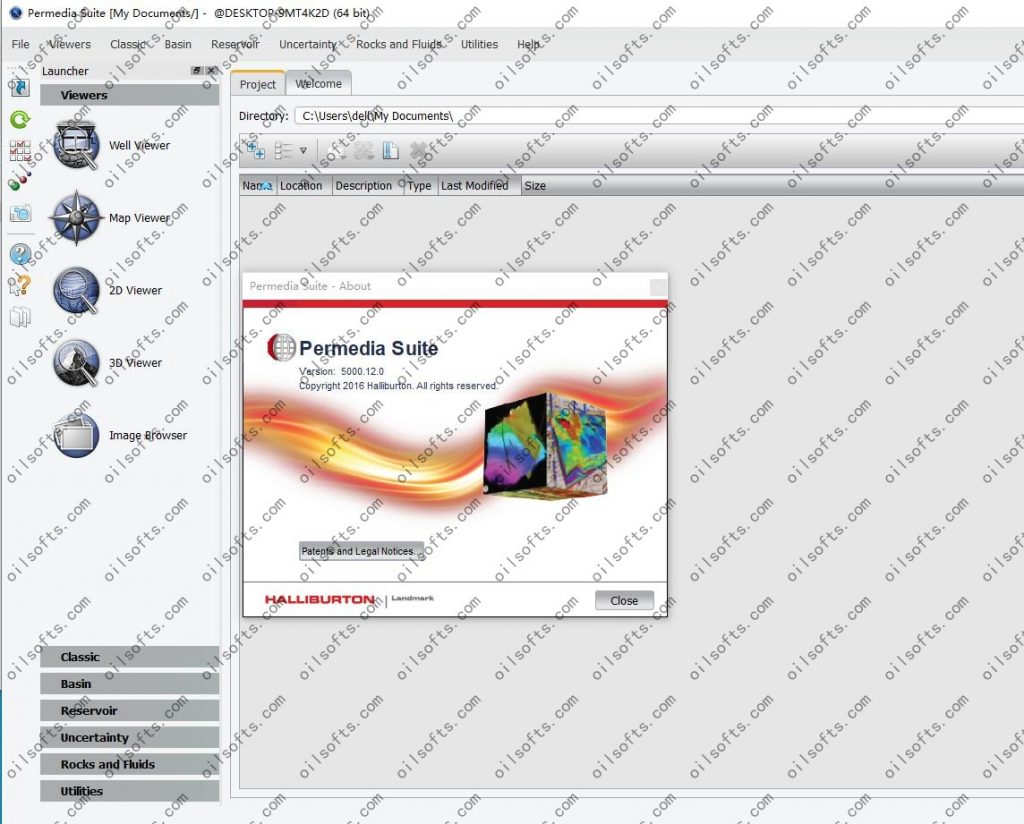
All Permedia® simulators are supported by a risking framework, which allows probability distributions to be wrapped around simulator inputs. Probability distributions can be assigned to key variables, sampled using a variety of techniques, and multiple simulations can be executed using distributed processing. Simulation outputs are ranked according to “goodness of fit” with observed data.

Permedia software is probably the best petroleum systems risking tool available since it can quickly evaluate so many realizations and scenarios, all at non-degraded spatial resolutions

Features

  • Mesh and fluid modifications
    Values in basin meshes are deterministic: each element contains a single value for a key property. With Permedia software, it’s easy to add uncertainty to petrophysical and fluid properties by assigning distribution types to model parameters, as well as set correlations between inputs. This allows you to stochasticize model inputs.
  • Batch process multiple scenarios
    In addition to adding stochastic uncertainty to model inputs, construct multiple models that reflect specific model scenarios, for example, uncertainty about fault sealing attributes, the quality and extent of specific source rocks, etc., and use Permedia Batch Manager to run the scenarios any number of times.
  • Ease of post-processing analysis
    Interrogate the results of multiple scenarios in any number of user-defined ways. Permedia software allows you to constrain the data that is summarized by parameter, time, region and rock body. For example, from tens to hundreds of simulations you might only want to see the mean petroleum saturation in a specific reservoir at present day.
  • Compare model and observed data
    Compare model results with observed data (e.g., well-based log-calculated hydrocarbon saturations) using Permedia Correlation, based on user-specified search radii and goodness of fit criteria.
发表在 钻井测井软件 | 标签为 , , , | permedia 5000已关闭评论

StrataBugs 2.1

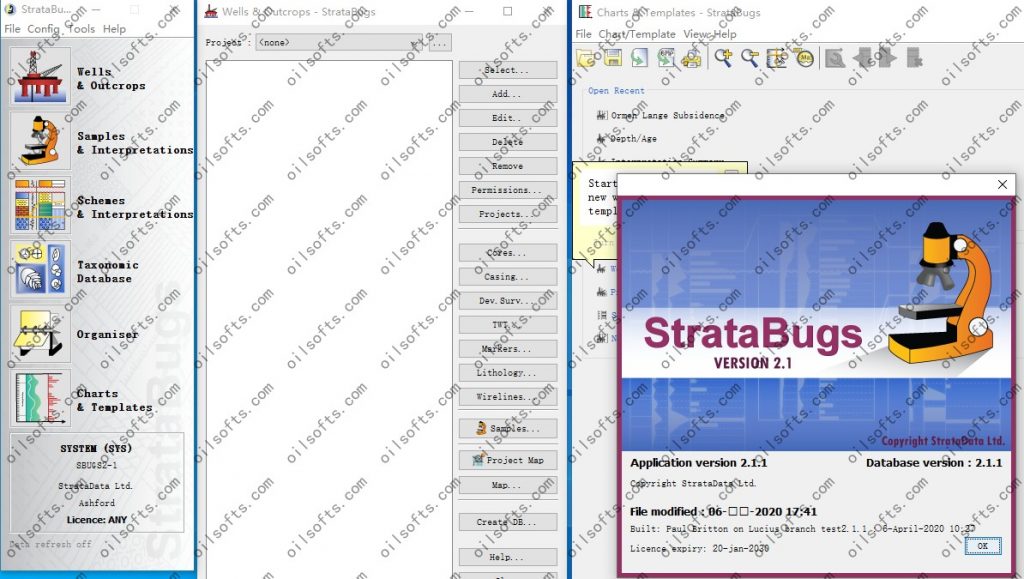
StrataBugs provides the ultimate solution in biostratigraphic data handling for both data generators and data users.

Using StrataBugs you can record, store, manipulate and display biostratigraphic and geological data including wireline logs and graphic lithologies for one or multiple wells.

Import contractors’ data and export traded data to other systems or integrate with other corporate database systems.

All applications are supported by on-screen help.

The current production version of StrataBugs is v2.1.

发表在 其它 | 标签为 , , | StrataBugs 2.1已关闭评论

RMS 11.1,RMS 2023

What’s New in RMS 11.1?

Struggling with poor data? Not confident in your model?

With RMS 11.1, you can capture uncertainty throughout the interpretation process, generate multiple realizations, and build accurate and robust models with less data and in less time.

RMS 11.1

RMS 11.1, Emerson’s leading reservoir modeling software, contains

  • new features and large enhancements (described in full in the Release Notes PDF document),
  • many small enhancements and fixes to satisfy client requests and client-reported issues (described in full in the Improvements and Fixes PDF document).

Access these PDF documents from the RMS menu bar (HelpRelease Notes).

New Features and Enhancements for RMS 11.1

RMS 11.1 introduces new features and enhancements including, but not limited to, those described in the following subsections.

RMS Plugins

  • RMS selection tools from the Data Explorer can now be used within Plugin panels. The available selector options include horizons, wells, and trajectories.
  • It is now possible to set RMS plugins to sub levels in the RMS Data tree.
  • Support for storing the state of check boxes has been enhanced. While previously, only the checked state was stored in the configuration, now the unchecked state is also stored, with the value None.

Roxar API

  • The Roxar API has been enhanced to provide full access to grid geometry; users now are able to create or update grid models with custom grid geometry.

3D Grids and Property Modeling

  • Improvements to the Channels NGOM job (see also Channels Next Generation Object Modeling):

    • New method for editing the channel shape, and shape editors are now expanded in Edit mode.

    • Distributions can be visualized in a plot for easier QC of the input data.

    • New, and more intuitive, icons introduced to describe to which directions trends will be applied.

      In the Volume fractions section, when setting the direction according to the grid layout, select between I, J, or K.

      When using trends as input to geometries, the directions are set according to the channel azimuth; select between Along channel, Perpendicular to channel and In depth.

    • Minor performance issues has been addressed to further enhance the usability of the job.

  • The i-Task for creating logs has been converted to a job in RMS and renamed as the Create Blocked Well Log job; as such, this can now be incorporated into automated workflows to ensure repeatable results (see also Creating Blocked Well Logs).

Presentation, Flexibility, and Usability

  • Several enhancements further increase the effectiveness of the existing workflow management capabilities within RMS (see also Using Workflow Management):

    • A tooltip has been added for Notes in RMS workflows; this tooltip provides the user name of the user who last edited the note, and the date and time of when the editing was made.
    • In the Workflows Area, two new directional arrow buttons have been added which allow you to go back, and go forward, to previously visited workflows in a project session.
  • You can now display point data in an Intersection view.

Import/Export Features

  • You can now export multiple SEG-Y data using the Export SEG-Y dialog box as opened from the Seismic folder in the Data tree (see also SEG-Y Multiple Export), and also export individual objects in the SEG-Y format, as in earlier versions of RMS, using the Export Single SEG-Y dialog box (see also SEG-Y Single Export).

Wells and Logs

  • The new Blocked Wells Log Calculator (IPL) job enables you to create new blocked well logs, based on mathematical operations on existing blocked logs. The functions used to create new logs can be stored in the calculator and applied to different sets of wells, and also be stored as IPL scripts for future use (see also Blocked Wells Log Calculator (IPL)).

  • A new Log Smoothing job has been added, enabling you to smooth log curves in the log runs of trajectories (see also Smoothing Logs).

  • The i-Task functionality for combining logs has been made into an RMS job, such that it can be accessed by IPL scripts, for example, as part of workflow which can be automated (see also Creating a Combined Log).

  • The new Create Horizon Picks from Surface job allows you to create Horizon well picks relative to a selected surface, with respect to the stratigraphic framework of the project (see also Creating Horizon Picks from a Surface).

  • The Remove Duplicate Horizon Picks dialog box allows you to delete duplicate Horizon well pick types in a well with respect to the stratigraphic framework in RMS (see also Removing Duplicate Horizon Picks).

  • The new Create Collection from Log Filter job allows you to create an RMS Data Explorer collection based on filtered logs (see also Creating Collections from a Log Filter).

Flow Modeling

  • The Composite Parameter Convert dialog box has been extended to support user-definition of the date format as applied in the name of result parameters (see also Converting Composite Parameters).

Seismic

  • 3D seismic data in an RMS project has four subset items:

    • Region of Interest
    • Inline
    • Crossline
    • Time or Depth

    Multiple subsets can be created; using these subsets, you can investigate the seismic data by playing through the seismic cube using the Seismic Fence Player, and perform seismic interpretation directly using RMS’ Model Driven Interpretation functionality.

Structural Modeling

  • The Depth Convert Horizons and Depth Convert Faults jobs have been renamed as Domain Convert Horizons and Domain Convert Faults respectively.

    Using these jobs, it is now possible to perform both Time and Depth conversions for horizons and faults data (see also Domain Converting Horizons and Domain Converting Faults respectively), including their surfaces, polylines and points (see also Domain Converting Points/Polylines/Surfaces).

  • The Horizon Uncertainty Modeling dialog box has been improved where, for Depth to Depth workflows, there is the possibility to directly output a Horizon model using the new From horizon and fault model option as the Model setup mode (see also Horizon Uncertainty Modeling).

Data Analysis

  • Visualize density distributions in scatterplots with four available visualization effects, which can be applied individually or combined, to assist in gaining a better understanding of the density distribution for the data in the scatterplot (see also Scatterplot Toolbar and Density Tab).

Utilities

  • The example project, Emerald, can be used to explore most features in RMS; download the project from www.roxarsoftwareportal.com

Changes Affecting Existing Projects

This section describes changes which affect existing projects through the released versions of RMS 11.1.

Note

Projects older than RMS 2013.1 are not accepted by RMS 11.1.

  • In accessing the license server to check for available RMS licenses, the environment variable now used for the address to the server is GEOMATICLM_LICENSE_FILE.

  • On the Windows platform, the FlexNet 11.14 licensing software uses the Local Service rather than the Local System account as used by previous versions of FlexNet. It is therefore required that an Administrator level user installs the service, but also that the Local Service account has appropriate Write permissions for the directory where the log file is located.

  • For the Channels NGOM job, the available trend input for Volume Fractions has now been limited to 1D trends to ensure correct use and representation of the trends. If other trends have been used in previous versions of RMS, the trend input will be set to No trends when loading the project containing those Channels NGOM jobs into RMS 11.1.

  • The Geometric Modeling job, when the Creating regions based on nearest well option is selected, has been updated to provide two modeling modes, Normal and Simbox. The previous Additional output option True distance in simbox has been removed from the dialog box. This could prompt some changes in existing projects.

  • As part of a redesign of all region functionality in RMS 11, generating a fault block parameter in the grid was transferred from the previous Create Grid Index Parameters dialog box to the new Create Region Partition dialog box.

    The removal of the functionality in the old dialog box could impair workflows when upgrading projects. In RMS 11.1 the generation of a fault block parameter has therefore been reintroduced to the Create Grid Index Parameters dialog box. It is now possible to create a fault block parameter in both the Create Region Partition and Create Grid Index Parameters dialog boxes.

  • In versions of RMS earlier than 11.1, when adding uncertainties to a Geometric Modeling job using surfaces as input where the calculation type Height above surface was selected, uncertainty had to be set as constants. However these values were not taken into consideration when running an uncertainty study.

    Setting uncertainty on surfaces has now been made available in RMS 11.1. Projects from earlier versions, with invalid constant input to the uncertainty, will therefore have this uncertainty removed when loading in RMS 11.1.

  • In RMS 11, running a Horizon Modeling job, for some cases of models with many conformal horizons with no isochores between the horizons, could exhaust resources such that RMS could fail to respond.

    A modification has therefore been made to the default algorithm of the Horizon Modeling job to address such cases. Now, without input isochores, the algorithm will produce more continuous thicknesses across faults than previously; when running with input isochores, changes should be minor.

Scheduled Changes After RMS 11.1

  • The Facies Elementary job is scheduled for deprecation, given its functionality is covered by other facies jobs in RMS. Maintenance will not be carried out on this job after this release of RMS 11.1, and the removal of this job from RMS is planned for the near future.

    The Facies Elementary job has no parameters that can be altered in a multi-realization uncertainty setting, making it unsuitable for a Big Loop or multi-realization scenario, in contrast to the other facies modeling jobs in RMS. The Facies Composite and newer Channels NGOM jobs both have superior functionality and flexibility, and should therefore be used as an alternative to, or a replacement for a Facies Elementary job.

发表在 地质建模软件 | 标签为 , , , | RMS 11.1,RMS 2023已关闭评论

Geogrid 1.19

主要产品:
◆ GeoGrid(GEOMapping)平面成图系统
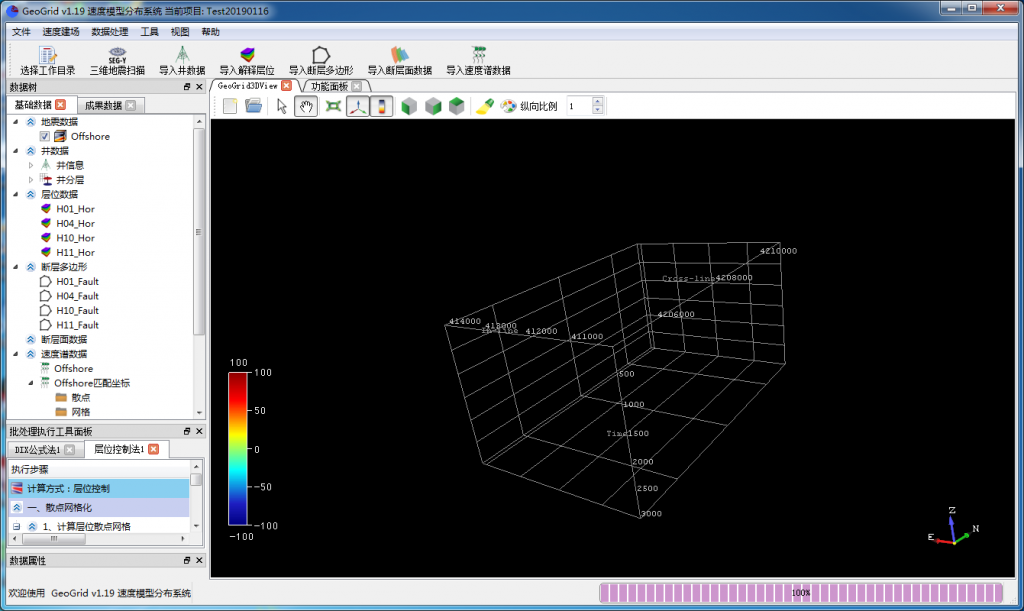
◆ GeoGrid速度模型分布系统
是一套专业地震速度建模及变速成图系统。
不仅适用于地层较平缓的地区,而且在地 质情况复杂及山地地区应用效果也非常出 色。
包括数据管理及显示、速度模型建立、速 度分析、变速空校等。

◆ GeoGrid三维可视化系统
◆ GeoGrid油田GIS数据库系统

发表在 绘图成图 | 标签为 , , , | Geogrid 1.19已关闭评论

Tempest Enable 8.5

Introduction

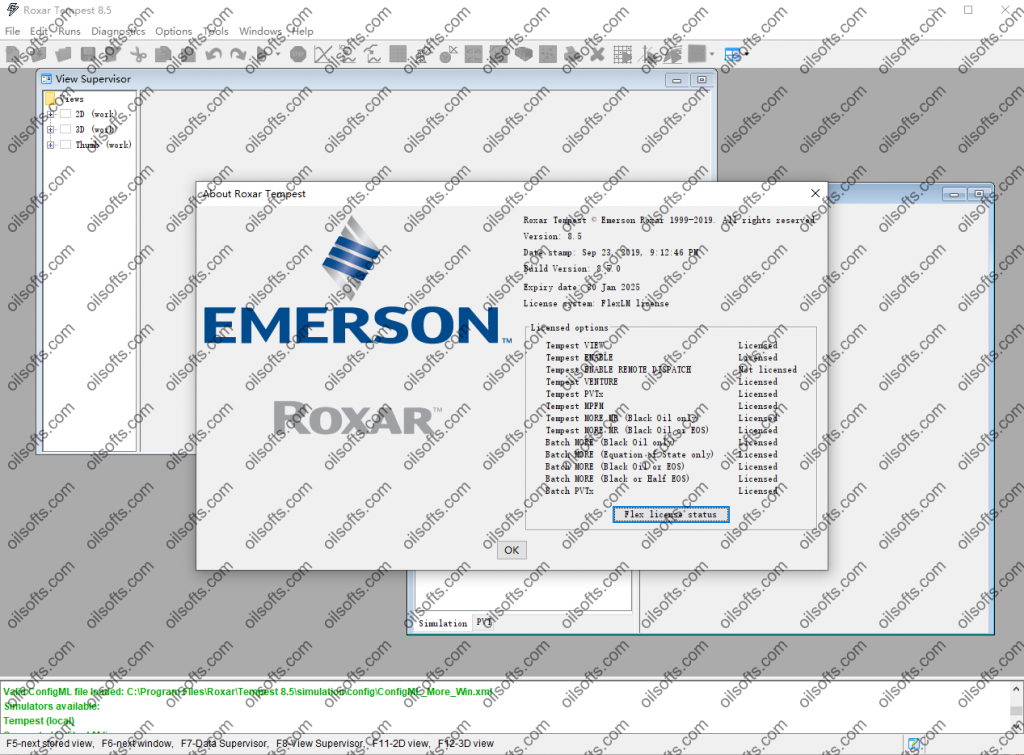
Tempest is the name for Roxar’s reservoir simulation software suite. This version of Tempest has five separately licensable modules:

  • Tempest MORE which is a full field black oil and compositional simulator.
  • Tempest VIEW which provides facilities for pre- and post-processing data for the MORE, ECLIPSE, VIP, CMG and POWERS simulators, as well as running simulation jobs. It includes the Lift program for generating well performance tables and the Report Generator for tabular file output.
  • Tempest ENABLE which is a statistical tool that you use with your reservoir simulator to manage and to aid the simulation process. ENABLE is used primarily for history matching, uncertainty analysis, and development optimisation.
  • Tempest PVTx which provides interactive equation of state modelling.
  • Tempest VENTURE which allows economic analysis of any loaded simulation model for asset valuation and optimization.

The modules are activated by options encoded in the program’s license file. The modules’ functionality is accessed from the main tabs in the Data Supervisor window. The program’s About Box, which is accessible using the Help|About… menu option, shows which programs and modules are available.

Facilities

This version of Tempest includes the following major facilities:

  • Tempest VIEW
    • Reading of MORE, ECLIPSE, VIP, CMG or POWERS output produced on Windows or Linux desktops or clusters.
    • Production of fast 3D views of the reservoir and its properties.
    • 2D graphing of well and group rates and totals.
    • Navigation of simulation input data structures.
    • Editing of simulation input decks.
    • Creation of simple MORE input simulation decks.
    • Preparation of well rate and event data.
    • Submission of simulation jobs, monitoring the run and automatic reloading of simulation results.
    • Generation of tabular reports.
  • Tempest PVTx
    • Definition of fluid systems for equation of state fitting.
    • Graphical and tabular display of observed and simulated PVT experimental results.
    • Tuning of equation of state parameters to experimental results.
    • Output of PVT data ready for inclusion into simulator input decks.
    • Output of calibration tables for the Roxar multiphase flow meters.
  • Tempest VENTURE
    • Automatic creation of annual production statements for any loaded simulation – MORE, ECLIPSE, VIP, CMG or POWERS.
    • Interactive creation of an economic model, with full save and restore.
    • Discounted cash flow analysis, with line plots and HTML report generation.
  • Common facilities
    • Production of high quality 2D line plots.
    • Saving and restoring the program state.
    • Printing directly to a printer or to a variety of file formats.
    • Copying of data to the clipboard for easy pasting into spreadsheets.
    • Batch mode running.
发表在 数值模拟软件 | 标签为 , , , , | Tempest Enable 8.5已关闭评论

sysdrill 11

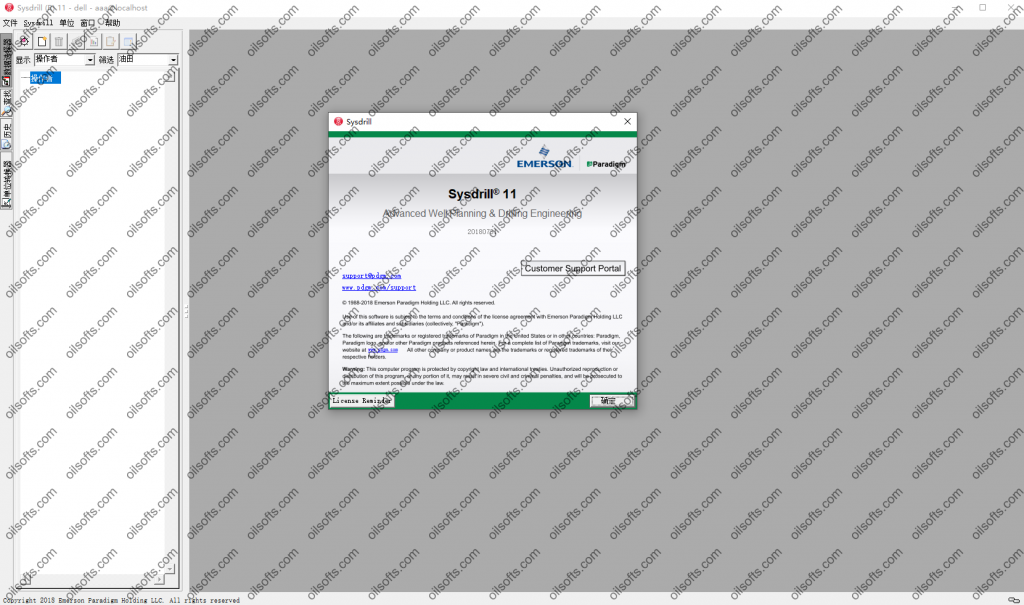
Paradigm® Sysdrill® 11 upgrades the Sysdrill 10.5 well planning and drilling engineering application by providing key functional enhancements and bug fixes.

Sysdrill 11 is compatible with both the Paradigm 15.5, Paradigm 17 and Paradigm 18 application suites.

The following enhancements are included in Sysdrill 11:
2D Graphics and Depth Logs
Enhanced layout editing with improved interactivity and new context menus.
Added ability to save Layouts with relative widths of each chart.
Added scroll bars to layouts.
3D Viewer
The length of labels has been set to a default value of 60. This value can be increased by modifying the Maximum Label Length preference located in the Graphs section of the Preference Editor.
The surface projection is now correctly interpolated between the surface and the planned sidetrack.
Casings
Collapse equations updated as detailed in ANSI/API Technical Report 5C3/ISO 10400:2007 Annex M
Triaxial values are now also displayed as stresses in the result Graphs, and in the Point Results data tables.
Catalogues
New material grades have been added into the catalogues:
For drill collars: Material Grades 45, 383, and 402
For drill pipes: Material Grades 16, 4-11, and 1953T1
Cementing
Sysdrill now supports stage cementing.
Help System
The Help system has been updated to include new features and changes associated with the Sysdrill 11 release.
The Help System now integrates the new Reverb HTML 5 technology. The documentation displays properly on all display devices.
Hydraulics
Numerical results are now shown in the Swab/Surge calculation editor and associated report template.
The minimal flow rate to reduce cuttings has been added into the Hydraulics calculation.
Hole cleaning with and without pipe rotation has been added to Sysdrill.
Import/Export
Sysdrill now supports IPM error models with alternate terms.
Magnetics
Magnetic models have been updated to include the latest published versions:
BGS Global Geomagnetic Model (BGGM) 2017 and 2018.
NOAA Enhanced Magnetic Model (EMM) 2017.
NOAA High Definition Geomagnetic Model (HDGM) 2017.
Note The BGGM and HDGM models are only available to customers who subscribe to those projects.
Miscellaneous
The last layout you saved is now available for all the graphs you display. Any new calculations will automatically inherit the information.
User-friendly color indications have been added into the results tables to indicate pass/failure rates for calculations.
Reporting
You can now set a preference to control whether the Zero Dogleg is represented by an arrow symbol or a decimal value in reports.
Well Planning
A DLS (Dog Leg Severity) column has been added into the Survey dialog.
A Slider tool has been implemented within 2D view graphs (Section, Plan and Traveling Cylinder) to allow interactive queries.
The Extended Reach Drilling (ERD) index has been added next to the DDI in the wellpath details of the actual and planned wellbores. It has also been added into the report.
Well Setup
You can now set up Rig Datums within the Slot Configuration Spreadsheet.
The Sysdrill user interface has been improved to enable a more efficient wellhead set-up.
When setting up your wellbore, you can add links to external data sources such as URIs or Excel files.
发表在 钻井测井软件 | 标签为 , , , , | sysdrill 11已关闭评论

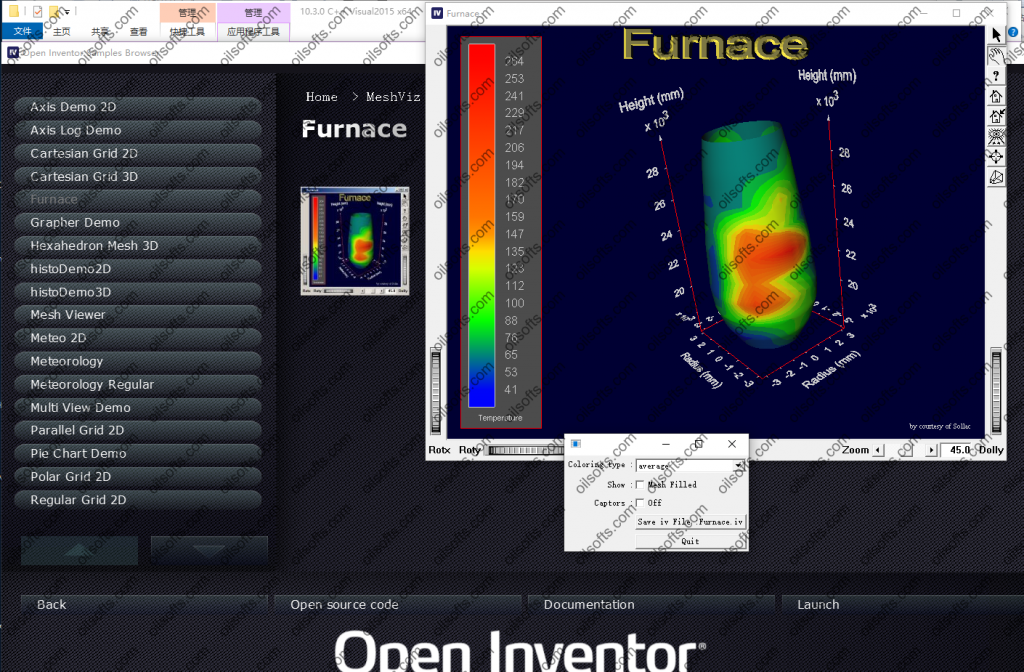
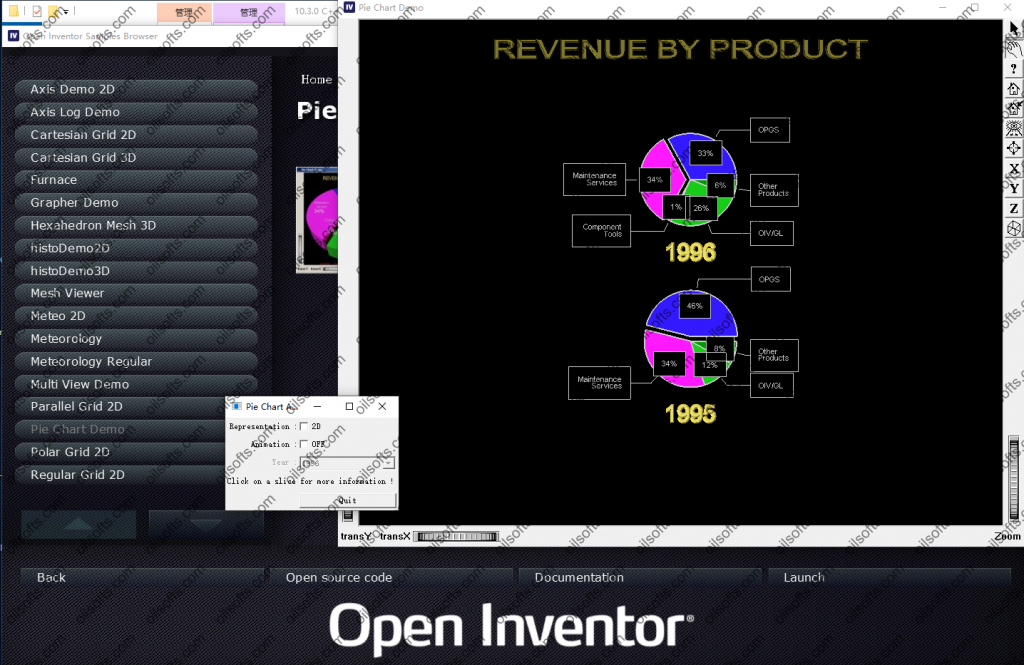
OpenInvertor 10.3.0 windows linux all full

        Mercury公司的Open Inventor 7软件是一个面向对象的、跨平台的专业3D图形化工具包,面向的对象包括工业强度的开发、交互和通过C++、.NET或Java构建的专业3D图形化应用程序。易于使用的应用程序端口、可拓展的结构和功能强大的全组件式架构给开发人员提供了一个高级平台的快速原型设计、高端开发和先进的3D图形应用程序。
Mercury公司的Open Inventor 7软件提供了加强的开发效率、显示质量、灵活性和可信度来快速开发您迫切需要的程序,这些程序要求稳定且不断优化的技术来迎接3D可视化领域的最高挑战。
“人类的3D工程”:
·高速发展高性能交互式的应用软件
·支持C++, Java 与 .NET 接口(API)
·支持所有平台从笔记本到进入式可视化
·具有功能强大的全组件式构架的工具箱
·在条件苛求的软件上依然具有良好的性能
·具有良好的可扩展性、兼容性和开放性
·专业的工具包、高附加值
·体数据可视化、科学数据可视化、高质量描绘显示、虚拟现实
Open inventor 支持大量3D的特征:
·高级多通道处理能力并支持多通道扩展
·体数据的交互式切割与漫游
·大模型的可视化
·处理大数据集的能力
·实时性交互分析
面向工业强度的专业3D图形开发工具包
·加快您的应用程序设计、开发和维护的周期
·通过先进的三维可视化和程序设计来提高您的显示质量
·通过初级的摘要和基本的图形技术来确保您的投资。
·提供先进的基于领先的开放标准的支持
应用领域:
商业图形、机械CAE和CAD、绘画、建筑设计、医学和科学图像、化学工程设计、地理科学、虚拟现实、科学数据可视化、AEC和仿真、动画

windows version
OpenInventorC++1030-Windows-Visual2015-x86_64.exe
OpenInventorC++1030-Windows-Visual2017-x86_64.exe
OpenInventorJava1030-Windows-x86_64.exe
OpenInventor.NET1030-Windows-Visual2015-x86_64.exe
OpenInventor.NET1030-Windows-Visual2017-x86_64.exe

UBUNTU 18.04 version
openinventorc++_10.3.0_amd64.deb
openinventorc++-headless_10.3.0_amd64.deb

RHEL7 version
OpenInventorC++1030-Linux-gcc48-x86_64.rpm
OpenInventorJava1030-Linux-x86_64.rpm

发表在 其它 | 标签为 , , , , | OpenInvertor 10.3.0 windows linux all full已关闭评论

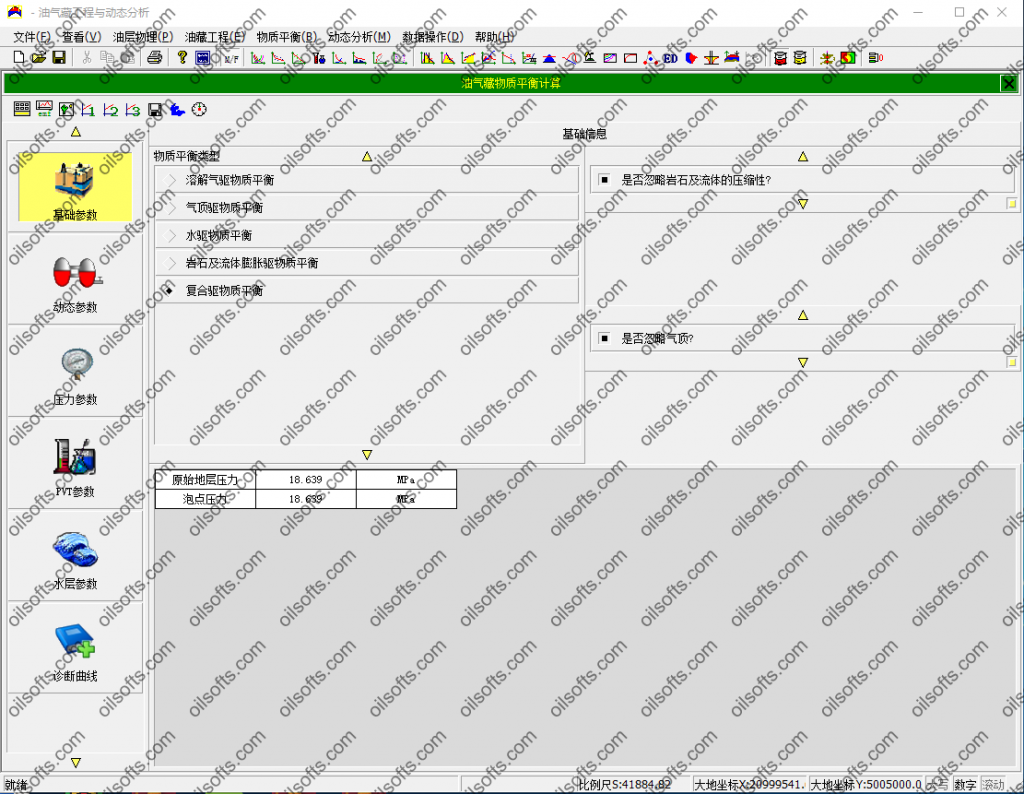
油气藏工程与动态分析软件 restools

油气藏工程与动态分析软件 restools

发表在 其它, 采油试井压裂 | 标签为 , , , | 油气藏工程与动态分析软件 restools已关闭评论

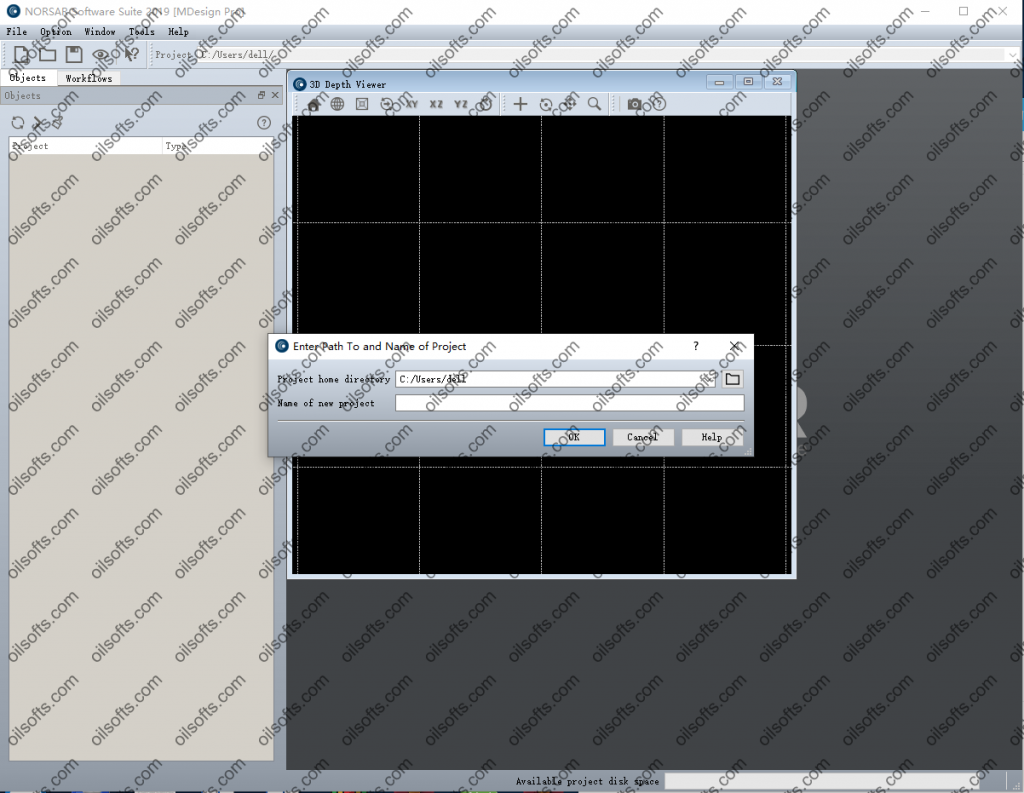
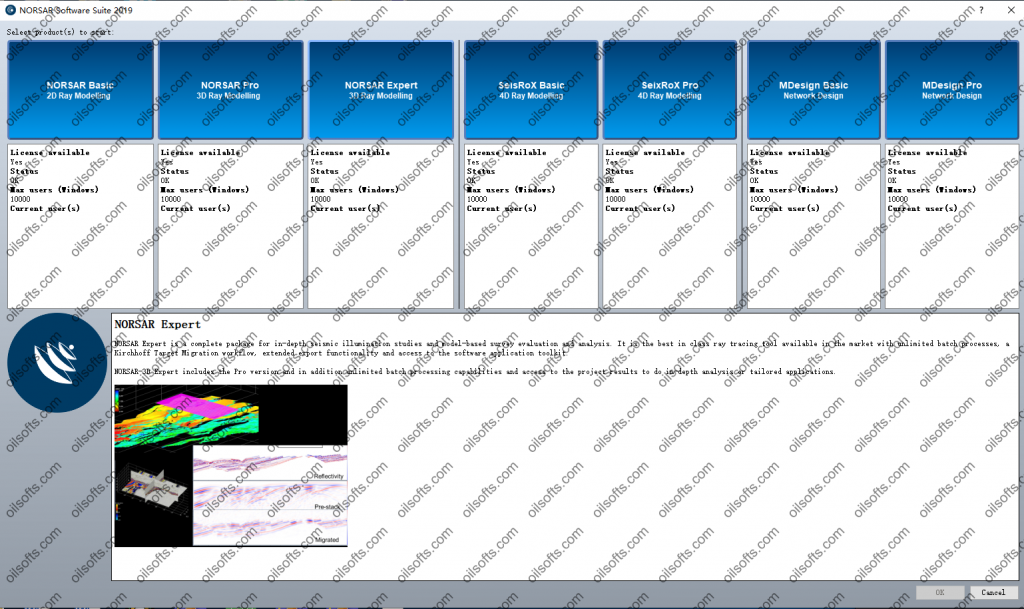
norsar 2019 seisrox 2019 MDesign 2019

MDesign Pro

MDesign Pro includes all the Basic functionality, and in addition it contains the Focusing workflow.

MDesign’s Focusing analysis shows the resolution for migration based location methodologies – typically used for dense surface arrays and ocean bottom networks. The focusing of seismic energy at a given location can be determined using Point Spread Functions, which incorporate the network layout, the velocity model, and the shape and frequency of a source wavelet, to compute the imaging response. By generating Point Spread Functions throughout a model region, the effectiveness of a given sensor configuration can be evaluated. This analysis allows the user to optimise a sensor layout by ensuring, sensor count, sensor spacing, line length and line spacing are all sufficient for a given target region.

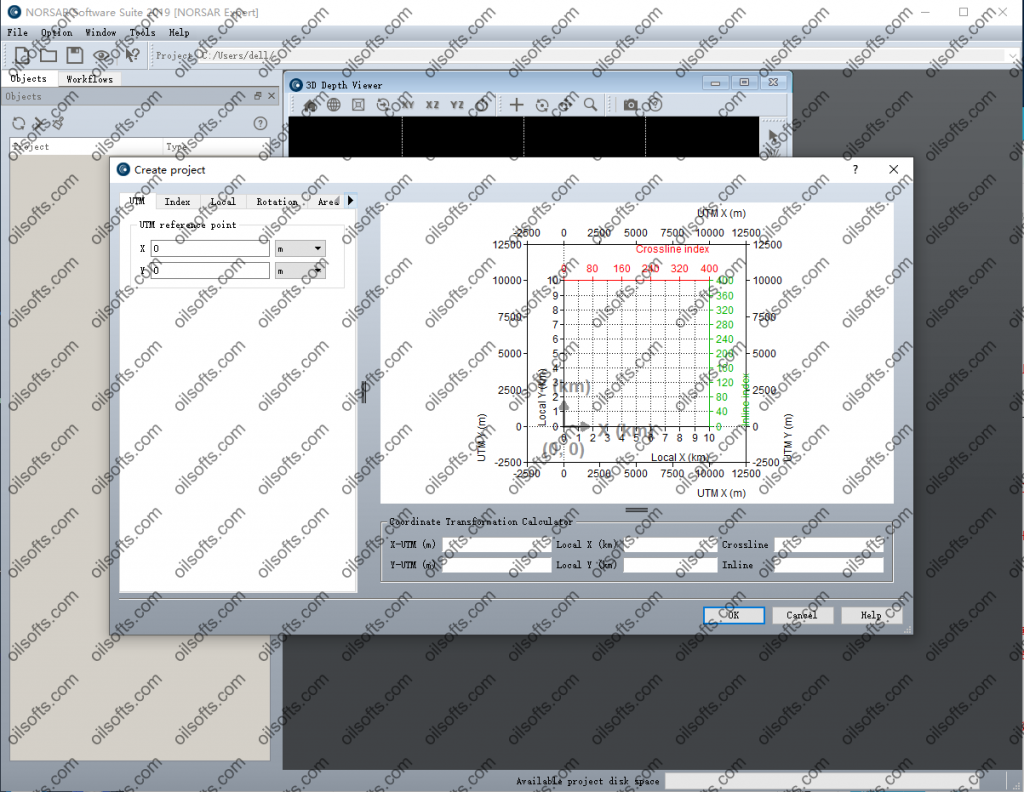
NORSAR Expert

NORSAR Expert is a complete package for in-depth seismic illumination studies and model-based survey evaluation and analysis. It is the best in class ray tracing tool available in the market with unlimited batch processes, a Kirchhoff Target Migration workflow, extended export functionality and access to the software application toolkit.

NORSAR-3D Expert includes the Pro version and in addition unlimited batch processing capabilities and access to the project results to do in-depth analysis or tailored applications.

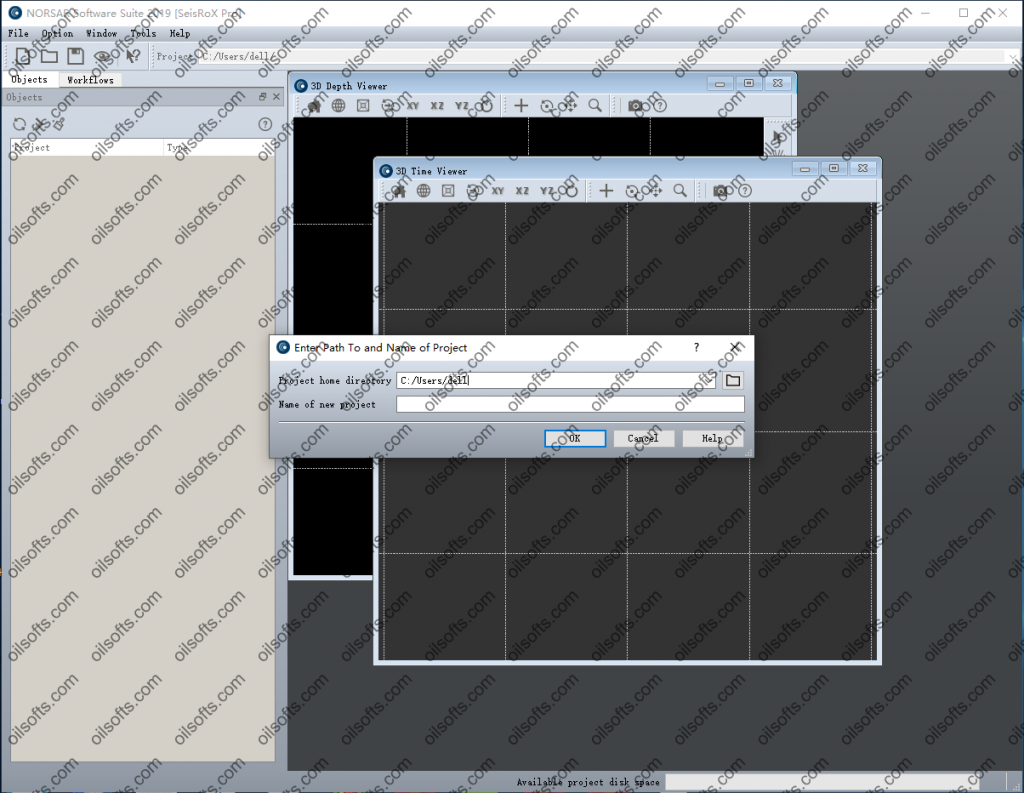
SeisRoX Pro

SeisRoX Pro includes all the Basic functionality, and in addition it contains a full-field PSDM simulation workflow. With the Pro version, larger scale modelling is done by utilizing space-varying Point Spread Functions. Detailed studies of the space-varying PSFs can be done with the new PSF focusing map.

SeisRoX Pro also includes Rock Physics transformations to describe and calculate the relationship between geological properties and the effective (average) elastic and seismic properties to be used in the modelling. With the Rock Physics functionality the seismic response of rock property changes can be studied.

发表在 正演反演软件 | 标签为 , , , | norsar 2019 seisrox 2019 MDesign 2019已关闭评论

forward.net 3.0 2019

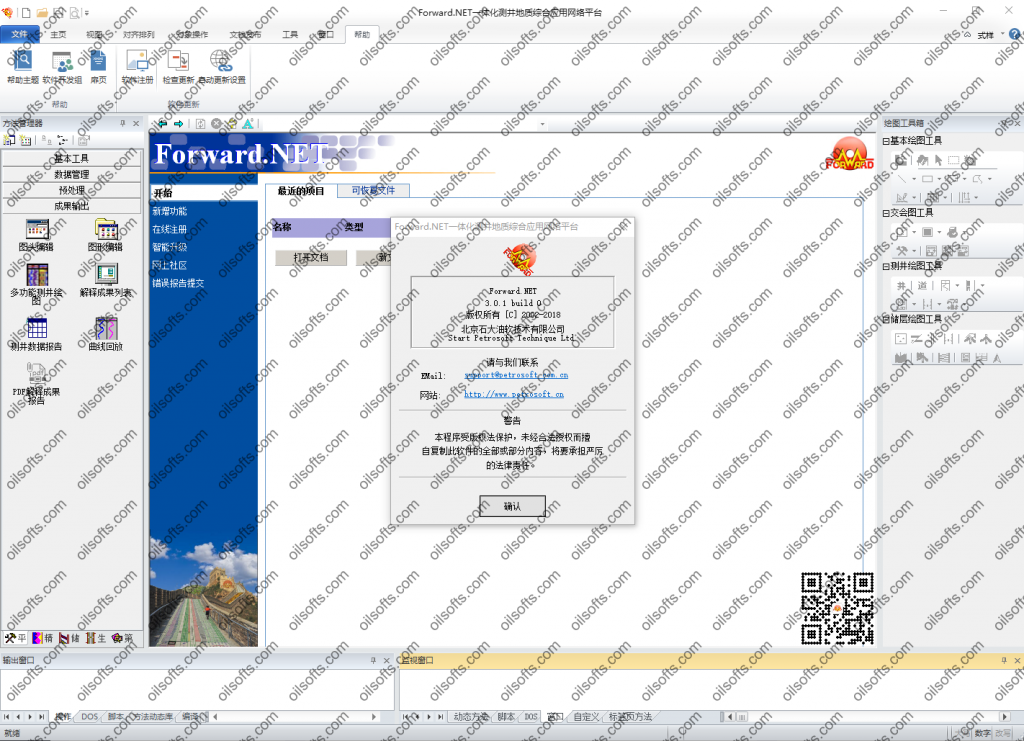
Forward.NET介绍 – 功能介绍
帮助和支持中心
Forward.NET 是勘探开发一体化测井解释平台。
Forward.NET 是油气评价、精细解释和储层分析的一体化综合平台。
Forward.NET 是数据管理、查询和应用一体化网络化平台。
Forward.NET 是软件应用、软件开发、软件服务一体化开放平台。
引入储层概念,提供区域综合研究的工作模式。
网络数据库支持受权用户的数据库建立、数据入库、出库的交互及批处理操作。在数据库支持下受权用户通过局域网或广域网在任何地方浏览、提取数据。
多口井测井资料可批处理方式一次加载。
借助类似Excel 的表格工具将其他数据库的表型数据加载到平台。
丰富的裸眼井、套管井资料处理评价方法集成,处理模块可任选。
借助岩心归位、多井交会图、测井计算器工具研究地区解释模型,确定地区评价参数,绘制解释图版。
借助连井剖面图,进行地层对比,确定标志层,测井曲线标准化,静态、动态显示和观测储集层。
借助两维、三维参数分布图,进行趋势分析。
多口井测井资料可批处理方式一次处理。
沿储层追踪测井曲线,按曲线特征以不同方式一次提取储层参数。
对储层岩性、物性、电性、含油性综合分析。
综合应用裸眼井、套管井测井资料,应用时间推移、“测井-注水-测井”技术等追踪储集层流体参数动态分布特征。
借助类似Excel 的表格工具进行参数集总。
借助单井成果图、连井剖面图、栅状图、趋势面、3D绘图、直方图-交会图、和制表工具随心所欲地组合出地质汇报图件。
Forward.NET提供了勘探、开发各阶段对测井资料评价的丰富工具,可用于油气评价和动态监测中疑难井、疑难层的解释,测井相沉积研究,关键井研究,多井评价,储层参数分布研究,是勘探决策、储量评估、开发部署中测井分析家和地质家真正的帮手。
Forward.NET是一个开放的平台,是一个以软件用户为中心的平台。数据底层采用根据勘探开发测井数据特点设计的WIS格式,并为程序开发提供大量的输入输出接口函数。绘图底层的提供了基本绘图对象、交会图对象和井绘图对象的程序开发框架。熟练的VC++开发人员借助Forward.NET提供的开发环境可开发出自己的动态对象、动态工具,甚至可以开发出自己的处理系统。熟悉VB的解释人员可借助Forward脚本,熟悉FORTRAN的人员可借助FOR编译器方便地开发自己的测井处理模块。

发表在 钻井测井软件 | 标签为 , , , | forward.net 3.0 2019已关闭评论

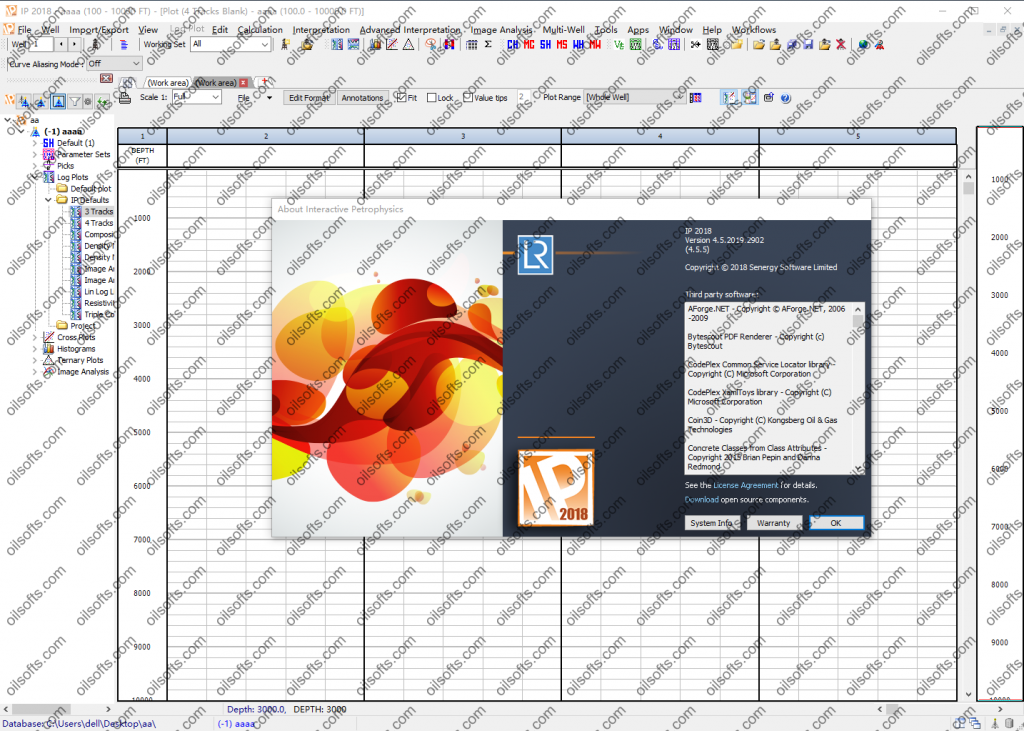
IP 4.5 2019

IP 2018 Enhancements
· User Sessions – The user can now save a work ‘session’, allowing them to return to where they left off after an interruption.
· Hide Backup Sets – Backup parameter sets created by MUA may now be hidden from view.
· Cascade / Tile Buttons – Cascade and Tile buttons have been added to the bottom right of the Status Bar.
· Detach Multi-Well Logplots – The Multi-Well Correlation Viewer can now be detached from the main IP window.
· Logplot Enhancements – Area Zoom and Unhide All Hidden Tracks.
· Curve Grouping – Curves can be grouped in the Curve Header module. The DB Browser can now show them grouped together as a single curve group. The DLIS loader can export Grouped curves as a single multi-dimensional curves
· 3D-PP Tops Set Sorting – The list of Correlation Zone Sets can now be sorted in the 3D-Petrophysics setup.
· Performance Improvements – Numerous performance improvements to speed up the ability to import, process, save and plot very large data files within IP.
IP 2018 New Features
· NMR Interpretation module – the NMR interpretation module has has a major upgrade. New features include:
· Calculation of a T2 Wet – a T2 distribution with the Hydrocarbon signal removed, and replaced with a Water signal.
· Saturation Height Modeling – New options in the Capillary Pressure Functions and Saturation vs Height Curves modules have been added.
· User Equations may now be used to fit individual curves to each core plug;
· Wells can be grouped to share a common Free Water Level. This can be interactively edited on a multi-well plot.
· New Licensing System – The licensing system has been replaced with the new LiMBR system designed to work with all LR software products in the future.
· Coordinate Reference Systems – IP now supports a large number of Coordinate Reference Systems for well position. Please read the documentation for important information on upgrading existing IP wells to the new IP2018 format.
· Primary Well Identifier – The way in which wells can be identified in IP can now be adjusted between the following identifiers – Well Name, UWI or API
· Box and Whisker Plots – Single and Multi-Well Box and Whisker plots have been added.
· Star and Spectral Plots – Single and Multi-Well Star and Spectral plots have been added.
· Acoustic Processing Updates – New Reflection Processing Workflow. New Rose plots for Anisotropy Fast Angle display. Many other new enhancements.
· Production Logging Updates – New Velocity Calculation Module designed for PL Array tools considers changing spinner position and fluid holdup at every depth level.
· Brittleness Calculation – A new Brittleness Index has been added to Unconventional Toolbox Rock Mechanics

发表在 钻井测井软件 | 标签为 , , | IP 4.5 2019已关闭评论

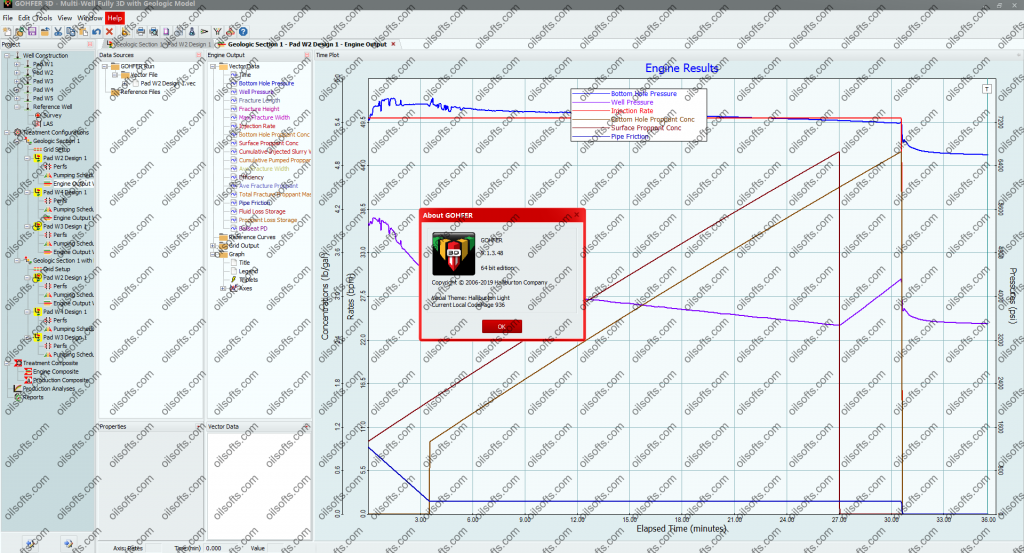
gohfer 9.1.3 2019

GOHFER, which stands for Grid Oriented Hydraulic Fracture Extension Replicator, is a planar 3-D geometry fracture simulator with a fully coupled fluid/solid transport simulator. GOHFER was developed by Dr. Bob Barree of Barree & Associates in association with Stim-Lab, a division of Core Laboratories. GOHFER has been continually refined using established formulations that have been verified in Stim-Lab’s laboratory and in the field.

A regular grid structure is used to describe the entire reservoir, similar to a reservoir simulator. The grid structure allows for vertical and lateral variations, multiple perforated intervals as well as single and bi-wing asymmetric fractures to model the most complex reservoirs. GOHFER allows modeling of multiple fracture initiation sites simultaneously and shows diversion between perforations. The grid is used for both elastic rock displacement calculations as well as a planar finite difference grid for the fluid flow solutions. Fluid composition, proppant concentration, shear, leakoff, width, pressure, viscosity and other state variables are defined at each grid block.

The in-situ stress is internally calculated from pore pressure, poroelasticity, elastic moduli and geologically consistent boundary conditions. The width solution is fully 3-D allowing shear decoupling and local displacements are controlled by local pressures and rock properties. Screenouts consider localized leakoff and proppant holdup and are not assumed to be caused by pad depletion or insufficient width. Fracture extension is based on a smoothly closing tip model and eliminates the fictitious singularity at the tip as well as the stress intensity factor.

The fracture extension and deformation model in GOHFER is based on a formulation that expects the formation to fail in shear and be essentially decoupled. Most models assume linear-elastic deformation of a fully coupled rock mass. In shales the assumption of shear is critical. Along with this GOHFER accounts for pressure dependent leakoff, transverse storage in horizontal and off-angle fracture components, and pressure dependent modulus of the bulk rock mass. All these things happen as the formation is stressed to the shear failure point. The result is higher treating pressures, smaller fracture heights, and more difficulty in placing proppant. The proppant transport model in GOHFER also includes modeling of non-uniform solid and liquid velocities, solid holdup, and variable transmissibility linked to fracture offsets and irregularities.

GOHFER allows geologic structure to be included in the modeling to simulate fracture growth in complex folded and faulted regions. Fluid and proppant injection is automatically redistributed at each timestep to model simultaneous injection into multiple perforation sets or clusters in limited-entry or horizontal well treatments. Perforation erosion and variable near-well tortuosity are modeled based on simulation of both laboratory and field studies.

GOHFER models both horizontal longitudinal and transverse fractures (multiple transverse planar fractures off of a single wellbore). GOHFER can represent the 3D stress tensor, non-orthogonal fractures, fracture reorientation, wellbore tangential stresses and breakdown conditions. It handles stress shadowing or fracture interference of multiple transverse fractures. Perforations can be selectively opened or closed throughout the simulation to model either stage by stage, multiple cluster treatments with fracture interference calculated between clusters as well as interference between stages (stage stress shadowing). Ball drop treatments may also be simulated.

GOHFER accurately models fracturing results as verified by radioactive tracer, micro-seismic and tilt-meter surveys. It is the only model that is backed by more than 20 years of laboratory research in all major areas of transport and mechanics. GOHFER includes the ability to import micro-seismic data to compare with simulation results.

Multi-Well Fully 3D Geo-Mechanical Earth Model

GOHFER 3D allows for the import and modeling of multiple wells, including vertical and horizontal, in the same project/model. It accounts for the fracture stress shadow interference between each fracture and stage, on each well. Multi-layer completions, zipper-fracs, and offset depletion effects can be simulated. Allows for the import of a fully 3D geo-mechanical earth model (from Petrel GSLIB file for example). Includes the optional input of 2D surface map with reference well logs. Permits the geo-steering of laterals and engineered completions. Incorporates the full processing of log or “core” from 3D earth model.

Log Processing

Three-dimensional fracture simulation requires data to describe reservoir properties and variations in rock properties and stress to model fracture growth and post-frac production. It is important to understand the sources of input data and the correct ways to process and interpret it. Digital well logs offer the best and most convenient method of getting data for model input. So called “mechanical properties” logs or full-wave sonic logs are not necessary, as the required mechanical and reservoir properties can be derived from commonly available log suites.

GOHFER allows direct importing of digital log data and has a built-in log analysis package to create a more accurate lithologic description which means less tuning and fewer assumptions. The result is an in-situ stress profile that is internally calculated from pore pressure, poroelasticity, elastic moduli, and geologically consistent boundary conditions. The package includes scatter plot capability to establish linear relationships between log inputs to derive correlations. Useful “log assistants” are available to aid the user in developing a consistent geologic description.

A primary input for generation of rock mechanical properties is the compressional sonic travel time (DTC). Along with an input DTC curve several synthetic DTC curves can be generated from other available log tracks. This feature can be used to quality-check the measured DTC and to generate mechanical properties when sonic logs are not available as well as be used to help identify gas-bearing intervals. The synthetic DTC curves are very robust and correlations developed from a single input log can be used over a large area. Shear travel time (DTS) will be used if available, but is not needed to generate complete mechanical properties.

Pressure Diagnostics

Analysis of pre-frac injection/falloff tests can provide invaluable information about fracture closure stress, net extension pressure, pore pressure, reservoir flow capacity, the presence and stress state of natural fractures, leakoff magnitude and mechanism and many other parameters important to design. The correct execution and interpretation of these tests is critical to the fracture design process.

The Diagnostic toolkit contains all the tools necessary to perform injection/falloff analysis, after closure analysis and step rate injections. Injection/falloff tests can be used to determine closure pressure, net extension pressure, efficiency, the presence and stress state of natural fractures and the dominant leakoff magnitude and mechanism. Step rate injections can be used to determine pipe and near-wellbore friction, number of effective perforations open and frac extension pressure. Blowdown analysis can be used to estimate the wellbore compression at the beginning of pumping which provides a good value for the decompression at shut down. This can be used to estimate the amount of tortuosity required to match blowdown and determine a more accurate ISIP. After closure analysis can be used to define the reservoir flow capacity such as pore pressure and permeability. These methods first require the accurate identification of the reservoir transient flow regimes that occur after closure.

Production Prediction

GOHFER includes a complete production and economic analysis package that predicts production rate and volume both before and after frac. It also outputs many details regarding stimulation efficiency including all accountable damage components (to fracture conductivity), remaining effective frac conductivity, FCD, infinite-conductivity effective length, and NPV of design. GOHFER includes a filtercake deposition model related to permeability that is consistent with the expected formation flow capacity rather than fluid properties. Treatment and product costs and prices must be supplied by the user.

GOHFER uses the Stim-Lab Predict-K proppant database of more than 200 materials that have been studied extensively under actual field conditions of stress, time, and temperature. The cleanup and damage model incorporates the mechanisms identified during more than 30 years of research by StimLab (including multiphase non-Darcy flow, time dependent conductivity and stress/proppant crushing). is. The results have been verified and compared to hundreds of actual producing wells from around the world. The model has been proven to give reliable forecasts of production, if reservoir character can be defined. To our knowledge, there are no other production forecasting tools that come close to the sophistication and accuracy of GOHFER.

GOHFER runs the production analysis for the reservoir properties input to the model and for the fracture geometry, proppant distribution, proppant and fluid types that are used in the design. The model correctly handles production interference of multiple transverse fractures on horizontal wells and allows for the optimization of fracture spacing in unconventional reservoir development.

Production Analysis

The GOHFER Production Analysis module uses actual production data to analyze post-frac performance and assess stimulation effectiveness. It includes rate transient type-curve analysis, decline curve analysis, production forecasting to ultimate recovery, and flow regime identification. It can be used to determine fracture spacing and effective well spacing for horizontal wells, along with the fraction of the lateral producing


发表在 采油试井压裂 | 标签为 , , , | gohfer 9.1.3 2019已关闭评论