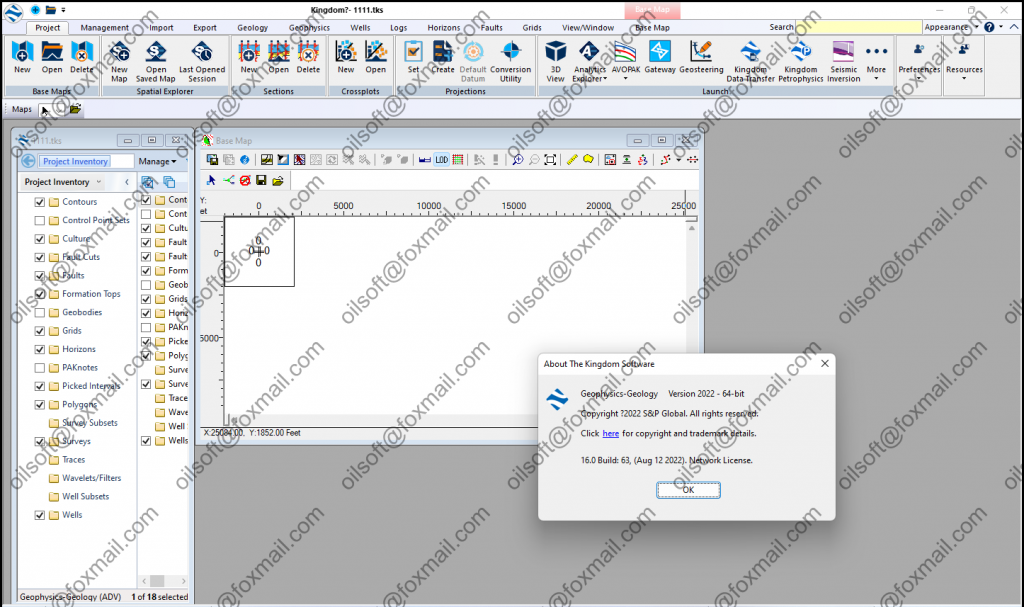
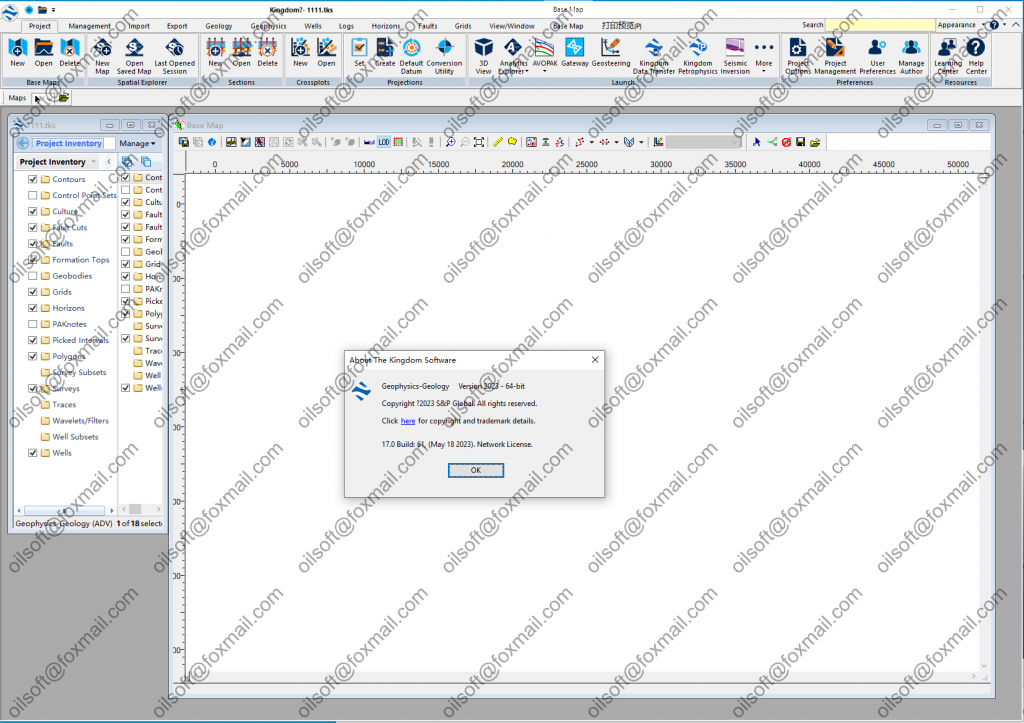
The Kingdom Software 2023 smt 2023

Kingdom 2023 Advancing fundamental workflows
• Visualize and explore Dynamic Property Model properties in 3D
• Advancing geological interpretation features
• Elevated cross section navigation
• Spatial Explorer expanded map posting
• Automated boulder picking and interactive faults
• Microseismic performance significantly improved
• Interpret and map control point sets in time domain
• New Kingdom Data Transfer options and data types

Section Enhancements Focus on geological workflows

Improved usability in section set up and display
• Faster log display setup using drag and drop
• Improvements in depth label increments based
on depth modes
• Greater flexibility with depth track posting
• Enhanced scale bar position options
• Option to hide wells without a top when flattening
• Pan and scroll in section with arrow keys
• Consolidated section toolbar option
• Open other authors’ saved sessions

and more ….

发表在 地震资料解释软件 | 标签为 , , , , | The Kingdom Software 2023 smt 2023已关闭评论

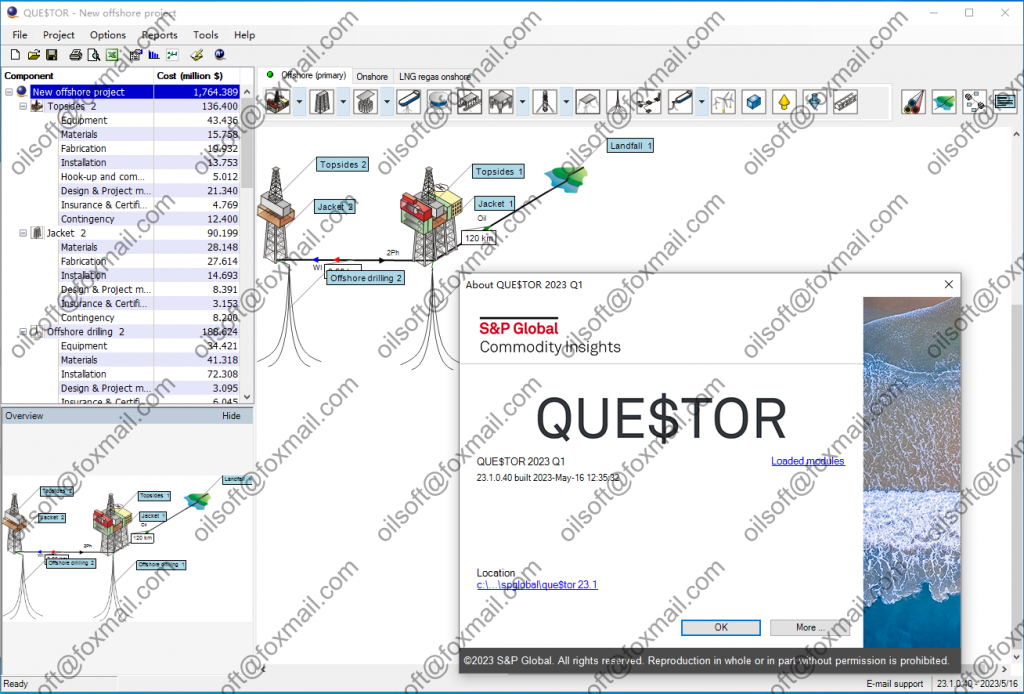
QUE$TOR 2023 Q1

In response to user feedback the following features have been
implemented in QUE$TOR 2023 Q1.
l Uninterruptible power supply (UPS) and battery system
l Updates to the greenhouse gas emissions report
l Drilling casing additions
l Downhole pressure temperature gauge fittings for subsea
production Xmas trees

发表在 其它 | 标签为 , , , | QUE$TOR 2023 Q1已关闭评论

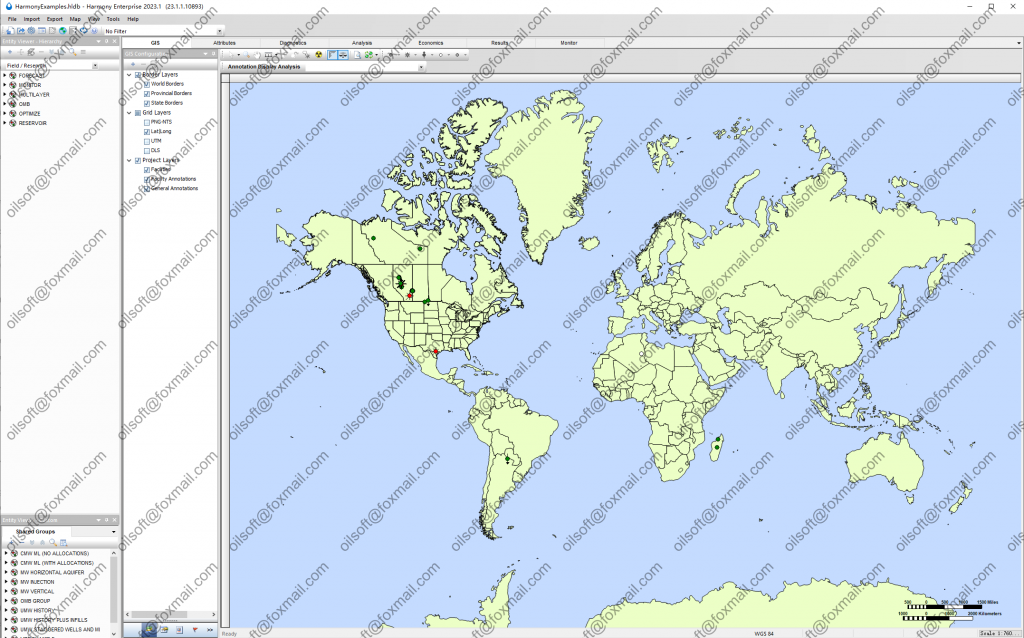
Harmony Enterprise 2023.1

Harmony Enterprise 2023.1 Release Notes (2023/04/17)
Wellhead forecasting for Extended Numerical Models
Wellhead forecasting is now available for Extended Numerical Models (single well and multi-well). Previously, wellhead forecasting was only available for Analytical Models and Numerical Models. With this enhancement, you can incorporate wellbore flow rates and pressure losses into Extended Numerical Models, forecast into the future using a specified wellhead pressure constraint, and include changing wellbore configurations in forecasts to compare potential wellbore intervention strategies.

Quickly produce sensitivities on Extended Numerical Model forecasts
Extended Numerical Model calculations previously ran from the beginning of production. Now, if only forecast parameters have changed since the model was last run, only the forecast period is recalculated, making the forecast optimization workflow faster. This enhancement applies to all Extended Numerical Models (single well and multi-well, conventional and unconventional).

Anisotropy for Conventional Extended Numerical Models
Define different permeabilities in the x- and y-directions for Conventional Extended Numerical Models (single-well and multi-well). You can achieve better history matching and create more accurate forecasts for the plays where permeability depends on direction with this enhancement.

Changing skin with time for Extended Numerical Models
The option to change skin multiple times throughout well production has been added. You can model skin changes during the well’s production history and during the forecast. Changes in skin can be added to models using a ramp or step change. This enhancement applies to all Extended Numerical Models (single well and multi-well, conventional and unconventional).

Different geomechanics for matrix and SRV regions for Unconventional Extended Numerical Models
Different geomechanics for matrix Geomechanics behavior for Unconventional Extended Numerical models has been available for several releases. This means permeability and formation compressibility can vary as functions of pressure. In previous versions, permeability and compressibility variations with pressure were modeled as the same in the matrix and SRV region. You can now set models up to use different variations of permeability with pressure between the matrix and SRV regions. This enhancement helps with more accurate modeling of the fracture network response during depletion and SRV regions for Unconventional Extended Numerical Models.

Performance Improvements for Common Operations
We strive for continuous enhancements to your user experience in Harmony Enterprise. Several improvements have been made to reduce load times of key day-to-day operations for Harmony Enterprise users. Specific improvements have been made for:

Switching between entities (60% improvement)

Loading and saving URM worksheets (40% improvement)

Loading and saving Optimize worksheets (25% improvement)

In a low latency environment users can expect to see improved speeds in the above areas.

We have also added a troubleshooting log feature to capture network performance metrics that impact Harmony Enterprise operations.

Minor improvements and resolved issues from Harmony Enterprise 2022.3
General
Language compatibility issues with using ‘q∞’ have been resolved.

Improved error messaging and troubleshooting steps have been added for if you encounter issues importing through Direct Connect (Enerdeq and IHDC).

VRR worksheets now remember user customizations.

When using ‘Toggle Color by Entity or by Dataset’ in Diagnostics, Static Pressures will also show as unique colors.

Issues with pasting a deviation survey onto an existing deviation survey have been resolved.

Importing
Datum information is now imported from Enerdeq and IHDC (The Hub) if it is available.

When using the database import with Aries analyses, duplicate calculated ratios are no longer added.

The “Import Warning” dialog will now appear each time a user is importing lower resolution data, not just once per session.

Reservoir
“Use Corrected Pseudo-Time” will now be an option in URM plots by default.

The telf value shown on the URM plot is now also available in the Results Viewer as (telf)plot.

When performing a rate-controlled wellhead forecast on a numerical model, the (þtf)calc is now populated in the Tables tab.

Entering Liquid Level and Average Liquid Gradient values will now only be required on an Extended Numerical Model if your forecast includes a pumping wellbore configuration.

The Defaults Manager populates the correct data from the URM (Vert w Fracture) to the Unconventional Numerical Model.

The history match and forecast persist on analytical or numerical models when an Optimize Configuration is modified.

The Automatic Parameter Estimation Average Error has been added to the Results Viewer for analytical and numerical models.

The default gridding values for the Vertical Numerical models are now finer for more accurate results.

Harmony Enterprise 2022.3 Release Notes (2022/12/06)
Extended Numerical Models (for wells, scenarios, and layers) within Reservoir
Prior versions of Harmony Enterprise included multi-well numerical models for groups of wells. You can now also create these enhanced numerical models on individual wells, scenarios, or layers. This new model is called the Extended Numerical Model. Results from Extended Numerical Models are also available for use in economics analyses, can be viewed in Production vs Forecast and Liquid Loading monitors, displayed in Results Viewer, and exported to Analytics Explorer.

Some advantages of using the Extended Numerical Models (as compared to using the original numerical models):

Ability to create multilayer models

(For Conventional models) flexible boundary shape

(For Unconventional models) ability to extend the reservoir beyond the length of the well

Calculation results are drawn on the plots while the calculation is running

Indicator lines allow shaded plots to easily be displayed at any time step

Flexible gridding options

Optimize Enhancements:
Advanced Forecast – Extended Numerical Model Support
Create and compare multiple Extended Numerical Model forecasts. Sensitize potential forecast conditions (such as sandface or wellhead flowing pressure, production rates, and wellbore configurations) to maximize your well’s production. Applies only to horizontal multi-fractured Extended Numerical Models.

Advanced Forecast – Numerical model-based IPR
Model-based inflow performance relationships (IPRs) are now available for Unconventional Numerical Models. Leverage your Extended Numerical Model to generate IPR curves at any point in your well’s forecast using Advanced Forecast. Applies only to horizontal multi-fractured Extended Numerical Models.

Choke support for TPC and Flowing Gradient
Evaluate current and hypothetical wellbore chokes in the Flowing Gradient and Inflow Performance Relationship / Tubing Performance Curve (IPR/TPC) worksheets. Optimize configurations can support the addition of chokes for single-phase gas and multi-phase systems. Available choke correlations include: Szilas, Ashford-Pierce, Perkins, Gilbert, Achong, Baxendell, and Ros. Harmony Optimize calculates both critical and sub-critical flow across chokes.

Minor improvements and resolved issues from Harmony Enterprise 2022.2
General
Units for KB elevation values coming from IHDC have been fixed.

Multiple datums are no longer displayed when there are multiple perforations.

Harmony no longer crashes when a default printer has not been assigned.

The Decline Forecast Resolution is now saved into the Templates in the Analytics Explorer connector.

Extended Colors can be used in an Azure environment

Errors regarding ‘failure to save’ no longer appear when switching between wells if no changes have been made.

Size and color of well symbols can now be customized in Spatial Explorer

Added a convenient way to gather troubleshooting details that can easily be sent to the support team to improve their ability to assist.

In case the Documents directory is not accessible, an option has been added to save log files in the directory specified by the user rather than in Documents.

Imports and Exports
In prior versions of Harmony Enterprise, when new production data was loaded, some decline parameters were recalculated, specifically updating their EUR and cumulative production. However, when the Append or Look Back options were used this sometimes resulted in incorrect values being stored in the database. Now, when production data is loaded, the decline parameters will not be recalculated and the values in the database will remain unchanged. Decline parameters will only update when the user loads the well(s) or performs Refresh Results for Declines.

Forecast
You can automatically Refresh Results for Decline. Set decline refresh preferences in the Options dialog. The refresh is executed from command line and can be added to the Windows Scheduler.

Reservoir
Wellhead Forecasting can be run on Analytical and Numerical models when the history match portion has the flow path set to gas lift.

When performing a rate-controlled wellhead forecast on a numerical model, the incorrect (ptf)calc value is no longer displayed in the Tables tab.

The Default Manager correctly transfers values from a URM Vertical with Fracture to Numerical Models

Analytical models use the correct wellbore configuration after changes to the wellbore configuration date without having to refresh the project.

Calculated Reservoir pressure is now displayed on Well Rate Time plots for Conventional and Unconventional numerical models.

In the Unconventional Numerical model, the limit for MinsrvXY gridding parameter was changed and an Extra Fine gridding option was added. This can be used to address oscillating forecasted rates for oil wells with low permeability.

Optimize
Optimize analyses using Pump Performance Curves will now extrapolate to a zero-head from the highest inputted rate.

The model history match is recalculated on Advanced Forecast after removing water volumes from the Production Editor

In Flowing Gradient, the oil/condensate rates are now displayed based on the gas type in the Properties Editor.

The functionality of Refresh Results for Optimize can be now executed from command line and can be added to the Windows Scheduler.

发表在 采油试井压裂 | 标签为 , , | Harmony Enterprise 2023.1已关闭评论

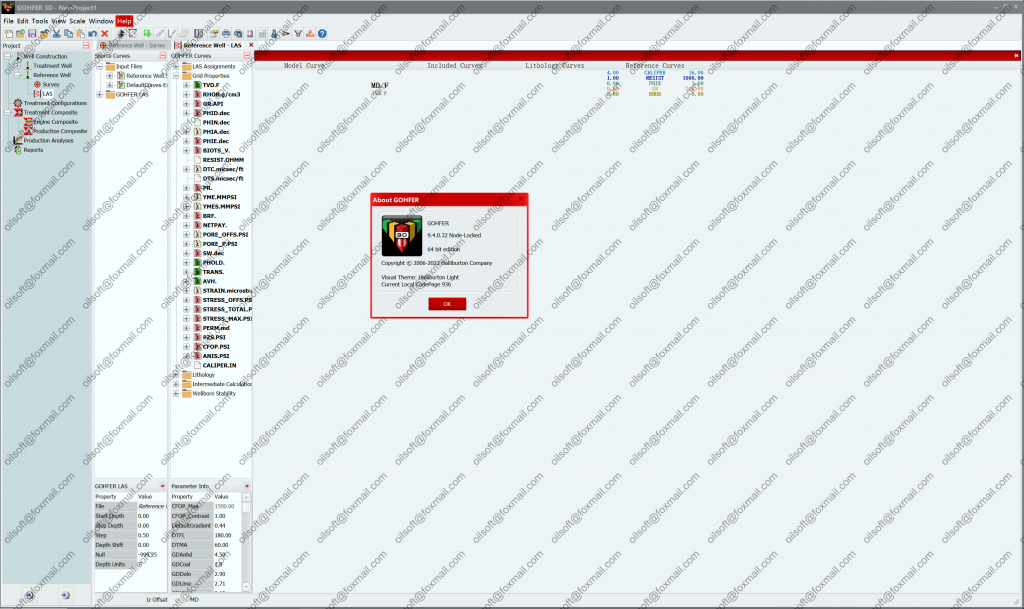
GOHFER9.4.0.32 20230407

GOHFER, which stands for Grid Oriented Hydraulic Fracture Extension Replicator, is a planar 3-D geometry fracture simulator with a fully coupled fluid/solid transport simulator. GOHFER was developed by Dr. Bob Barree of Barree & Associates in association with Stim-Lab, a division of Core Laboratories. GOHFER has been continually refined using established formulations that have been verified in Stim-Lab’s laboratory and in the field.

A regular grid structure is used to describe the entire reservoir, similar to a reservoir simulator. The grid structure allows for vertical and lateral variations, multiple perforated intervals as well as single and bi-wing asymmetric fractures to model the most complex reservoirs. GOHFER allows modeling of multiple fracture initiation sites simultaneously and shows diversion between perforations. The grid is used for both elastic rock displacement calculations as well as a planar finite difference grid for the fluid flow solutions. Fluid composition, proppant concentration, shear, leakoff, width, pressure, viscosity and other state variables are defined at each grid block.

The in-situ stress is internally calculated from pore pressure, poroelasticity, elastic moduli and geologically consistent boundary conditions. The width solution is fully 3-D allowing shear decoupling and local displacements that are controlled by local pressures and rock properties. Screenouts consider localized leakoff and proppant holdup and are not assumed to be caused by pad depletion or insufficient width. Fracture extension is based on a smoothly closing tip model and eliminates the fictitious singularity at the tip as well as the stress intensity factor.

The fracture extension and deformation model in GOHFER is based on a formulation that expects the formation to fail in shear and be essentially decoupled. Most models assume linear-elastic deformation of a fully coupled rock mass. In shales, the assumption of shear is critical. Along with this GOHFER accounts for pressure dependent leakoff, transverse storage in horizontal and off-angle fracture components, and pressure dependent modulus of the bulk rock mass. All these things happen as the formation is stressed to the shear failure point. The result is higher treating pressures, smaller fracture heights, and more difficulty in placing proppant. The proppant transport model in GOHFER also includes modeling of non-uniform solid and liquid velocities, solid holdup, and variable transmissibility linked to fracture offsets and irregularities.

GOHFER allows geologic structure to be included in the modeling to simulate fracture growth in complex folded and faulted regions. Fluid and proppant injection is automatically redistributed at each timestep to model simultaneous injection into multiple perforation sets or clusters in limited-entry or horizontal well treatments. Perforation erosion and variable near-well tortuosity are modeled based on simulation of both laboratory and field studies.

GOHFER models both horizontal longitudinal and transverse fractures (multiple transverse planar fractures off of a single wellbore). GOHFER can represent the 3D stress tensor, non-orthogonal fractures, fracture reorientation, wellbore tangential stresses and breakdown conditions. It handles stress shadowing or fracture interference of multiple transverse fractures. Perforations can be selectively opened or closed throughout the simulation to model either stage by stage, multiple cluster treatments with fracture interference calculated between clusters as well as interference between stages (stage stress shadowing). Ball drop treatments may also be simulated.

GOHFER accurately models fracturing results as verified by radioactive tracer, micro-seismic and tilt-meter surveys. It is the only model backed by more than 20 years of laboratory research in all major areas of transport and mechanics. GOHFER includes the ability to import micro-seismic data to compare with simulation results.

Multi-Well Fully 3D Geo-Mechanical Earth Model
GOHFER 3D allows for the import and modeling of multiple wells, including vertical and horizontal, in the same project/model. It accounts for the fracture stress shadow interference between each fracture and stage, on each well. Multi-layer completions, zipper-fracs, and offset depletion effects can be simulated. Allows for the import of a fully 3D geo-mechanical earth model (from Petrel GSLIB file for example). Includes the optional input of 2D surface map with reference well logs. Permits the geo-steering of laterals and engineered completions. Incorporates the full processing of log or “core” from 3D earth model.

Log Processing
Three-dimensional fracture simulation requires data to describe reservoir properties and variations in rock properties and stress to model fracture growth and post-frac production. It is important to understand the sources of input data and the correct ways to process and interpret it. Digital well logs offer the best and most convenient method of getting data for model input. So-called “mechanical properties” logs or full-wave sonic logs are not necessary, as the required mechanical and reservoir properties can be derived from commonly available log suites.

GOHFER allows direct importing of digital log data and has a built-in log analysis package to create a more accurate lithologic description, which means less tuning, and fewer assumptions. The result is an in-situ stress profile that is internally calculated from pore pressure, poroelasticity, elastic moduli, and geologically consistent boundary conditions. The package includes scatter plot capability to establish linear relationships between log inputs to derive correlations. Useful “log assistants” are available to aid the user in developing a consistent geologic description.

A primary input for generation of rock mechanical properties is the compressional sonic travel time (DTC). Along with an input DTC curve, several synthetic DTC curves can be generated from other available log tracks. This feature can be used to quality-check the measured DTC and to generate mechanical properties when sonic logs are not available as well as be used to help identify gas-bearing intervals. The synthetic DTC curves are very robust and correlations developed from a single input log can be used over a large area. Shear travel time (DTS) will be used if available, but is not needed to generate complete mechanical properties.

Pressure Diagnostics
Analysis of pre-frac injection/falloff tests can provide invaluable information about fracture closure stress, net extension pressure, pore pressure, reservoir flow capacity, the presence and stress state of natural fractures, leakoff magnitude and mechanism and many other parameters important to design. The correct execution and interpretation of these tests is critical to the fracture design process.

The Diagnostic toolkit contains all the tools necessary to perform injection/falloff analysis, after closure analysis and step rate injections. Injection/falloff tests can be used to determine closure pressure, net extension pressure, efficiency, the presence and stress state of natural fractures and the dominant leakoff magnitude and mechanism. Step rate injections can be used to determine pipe and near-wellbore friction, number of effective perforations open and frac extension pressure. Blowdown analysis can be used to estimate the wellbore compression at the beginning of pumping which provides a good value for the decompression at shut down. This can be used to estimate the amount of tortuosity required to match blowdown and determine a more accurate ISIP. After closure analysis can be used to define the reservoir flow capacity such as pore pressure and permeability. These methods first require the accurate identification of the reservoir transient flow regimes that occur after closure.

Production Optimization
The GOHFER Production Optimization feature provides a quick, convenient and robust method to optimize completions based on spacing (well spacing or frac spacing) and by length (frac length or stage length). Using a consistent set of inputs for well, reservoir and economic properties, GOHFER Production Optimization allows for multiple treatments to be created varying fracture treatment properties such as proppant concentration, horizontal well properties and materials. It will then provide plots comparing the treatments across a spectrum of user defined spacings or lengths. This can be used to determine an optimum, economic completion to add value to your asset.

Production Forecasting
GOHFER includes a complete production and economic analysis package that predicts production rate and volume both before and after frac. It also outputs many details regarding stimulation efficiency including all accountable damage components (to fracture conductivity), remaining effective frac conductivity, FCD, infinite-conductivity effective length, and NPV of design. GOHFER includes a filtercake deposition model related to permeability that is consistent with the expected formation flow capacity rather than fluid properties. The user must supply treatment and product costs and prices.

GOHFER uses the Stim Lab Predict-K proppant database of more than 200 materials that have been studied extensively under actual field conditions of stress, time, and temperature. The cleanup and damage model incorporates the mechanisms identified during more than 30 years of research by StimLab (including multiphase non-Darcy flow, time dependent conductivity and stress/proppant crushing). The results have been verified and compared to hundreds of actual producing wells from around the world. The model has been proven to give reliable forecasts of production, if reservoir character can be defined. To our knowledge, there are no other production forecasting tools that come close to the sophistication and accuracy of GOHFER.

GOHFER runs the production analysis for the reservoir properties input to the model and for the fracture geometry, proppant distribution, proppant and fluid types that are used in the design. The model correctly handles production interference of multiple transverse fractures on horizontal wells and allows for the optimization of fracture spacing in unconventional reservoir development.

Production Analysis
The GOHFER Production Analysis module uses actual production data to analyze post-frac performance and assess stimulation effectiveness. It includes rate transient type-curve analysis, decline curve analysis, production forecasting to ultimate recovery, and flow regime identification. It can be used to determine fracture spacing and effective well spacing for horizontal wells, along with the fraction of the lateral producing.

发表在 采油试井压裂 | 标签为 , , , | GOHFER9.4.0.32 20230407已关闭评论

JewelSuite GeoMechanics 2022.2

JewelSuite Geo Mechanics Is a professional software for designing 1 to 3D models. Create robust and professional models for better and more accurate analysis of potential geo mechanical hazards . Also define and design its performance for better drilling efficiency. Also minimize the potential hazards (drilling). JewelSuite Geo Mechanics software has the tools you need to design models and reduce risks, and it is enough for you to learn how to use them. Also, the relatively simple user interface of the program allows you to fully learn to work with different tools in the shortest possible time and have a detailed analysis without any guidance. JewelSuite Geo Mechanics Helps you identify stresses and mechanical properties of rocks on faults using stress. You can also identify fractures and different orientations of faults and reduce the potential hazards of the specified areas. The wonderful and varied modules that are included in this program will all help you in this regard. Create drilling models and consider their hazards.

1D Model module

Rapidly build and analyze well-centric geo mechanical models with JewelSuite Geo Mechanics. The 1D Model module also enables you to reliably predict abnormal pressure incidents during drilling to mitigate kicks, blowouts, and lost circulation. You can predict pore pressure using traditional methods such as Eaton, equivalent depth ration and Bowers calibrated with drilling data. You can also access advanced methods such as buoyancy, centroid, and effects of injection or depletion.

Wellbore Stability module

Reliably forecast wellbore instability before, during and after drilling to mitigate wellbore collapse, tight hole, stuck pipe, fishing, kicks, lost circulation, formation damage, casing deformation, and sidetracks.

The Wellbore Stability module enables you to quickly evaluate the drilling risk for proposed well plans by calculating wellbore failure along the well trajectory for a proposed mud program and predict the required mud weight to support wellbore stability and evaluate your casing design to prevent wellbore failure.

3D Model module

Capture the varying stresses, pore pressures, and rock properties of your entire field and build precise 3D geo mechanical models from 3D structural models and 1D well models. The 3D Model module addresses moderately complex geology without major stress distortions and overcomes the limitations of 1D depth stretching that can be used for wells in simple geology by honoring structural and stratigraphic constraints.

Fault and Fracture Stability module

Quickly model fault structures, stress, and pore pressure and analyze the effects of pressure changes during drilling and production operations. With the fault and fracture stability module, you can also analyze caprock integrity in order to determine the proximal distance to failure if pore pressure communication exists between your reservoir and surrounding rock.

Key features

A wide range of modeling tools focused on speed of analysis and ease of use are provided, allowing you to perform the following tasks:

  • Import petrophysical logs from the study well and offset wells, from files and in real time.
  • Interactively create composite logs.
  • Determine lithology and shale volume from gamma log measurements.
  • Import and display measured formation pressure tests, gas kicks, leak off pressures, loss of circulation, and mud weights.
  • Enter and display a well schematic.
  • Incorporate interval velocity information from seismic data.
  • Calculate and interactively modify overburden profile from composite density using bulk density and acoustic and user-defined curves.
  • Interactively draw and modify normal compaction trend lines.
  • Calculate pore pressure from trend line methods and interactively draw an interpreted pore pressure profile.
  • Interpret SHmin, and SHmax.
  • Calculate fracture gradient using several methods.
  • Define local porosity–effective stress relationships.
  • Identify, interpret, calibrate and predict loading and unloading depth zones.
  • Calculate centroid and buoyancy effects in permeable formations.
  • Calculate Poisson’s ratio, Young’s modulus, rock strength, friction angle, and compressibility.
  • Calculate porosity from density, acoustic and resistivity logs.

These tasks, among others, can be completed using sequence of dedicated workflow forms that guide you through the various high level workflows in a logical and intuitive way.


发表在 地质建模软件, 地震资料解释软件, 数值模拟软件 | 标签为 , , , , , , | JewelSuite GeoMechanics 2022.2已关闭评论

Eliis PaleoScan 2022.2

PaleoScan 2022 is a new generation of 3D seismic interpretation software that allows geoscientists build a geological model while interpreting seismic volumes. With this new release, Eliis continues to innovate seismic interpretation with more tools to interpret larger seismic data sets with added speed and precision. We also introduce advancements in the 2D workflow, to create a 3D Geo-Model from 2D lines interpretation.

The 2022 release brings more options to complete the workflow from exploration to reservoir characterization, with a suite of various applicative modules in geology (sequence stratigraphy, structural interpretation, geo bodies extraction) and quantitative interpretation (properties modeling, colored inversion, seismic to well tie and time-depth conversion). It also offers functionalities in spectral decomposition and color blending. Parallel computing has also been upgraded with the latest multi core technologies.

The core technology proposes a global approach to optimize the interpretation process and ensure the geological consistency at different scales. This methodology and workflow help interpreters to quickly understand the regional geology as well as reservoir detection.

The traditional workflow in seismic interpretation consists in tracking a set of horizons to obtain a geological model. Unlike such methods, based only on local analysis of the signal, PaleoScan is based on a comprehensive approach. It uses optimization algorithms to correlate the seismic traces and at the same time, build a geological model. The latter can be then refined by inserting or modifying discontinuity and continuity constraints such as faults or manually picked horizons.

With various interactive tools, interpreters can then quickly converge towards an optimum 3Dmodel with a high level of accuracy and precision. Once generated, the 3D Geo-Model proposes various applications, as summarized below:

• Computation of new attributes

• 3D horizons modelling

• Identification of geological targets (geo-bodies)

• Fault Enhancement

• Well correlation

The newly implemented 2D line interpretation workflow enables the user to apply the same processes on 2D data.

In this 2022 version, the most noticeable new features are:

• An AVO analysis is available,

• The Extended Elastic Impedance (EEI) workflow is available,

• The Least Squares inversion method is available,

• The RESQML.v2 format is available for the Geo Cellular Grid export,

• The Sessions are more robust and have been completed.

发表在 地震资料解释软件 | 标签为 , , , | Eliis PaleoScan 2022.2已关闭评论

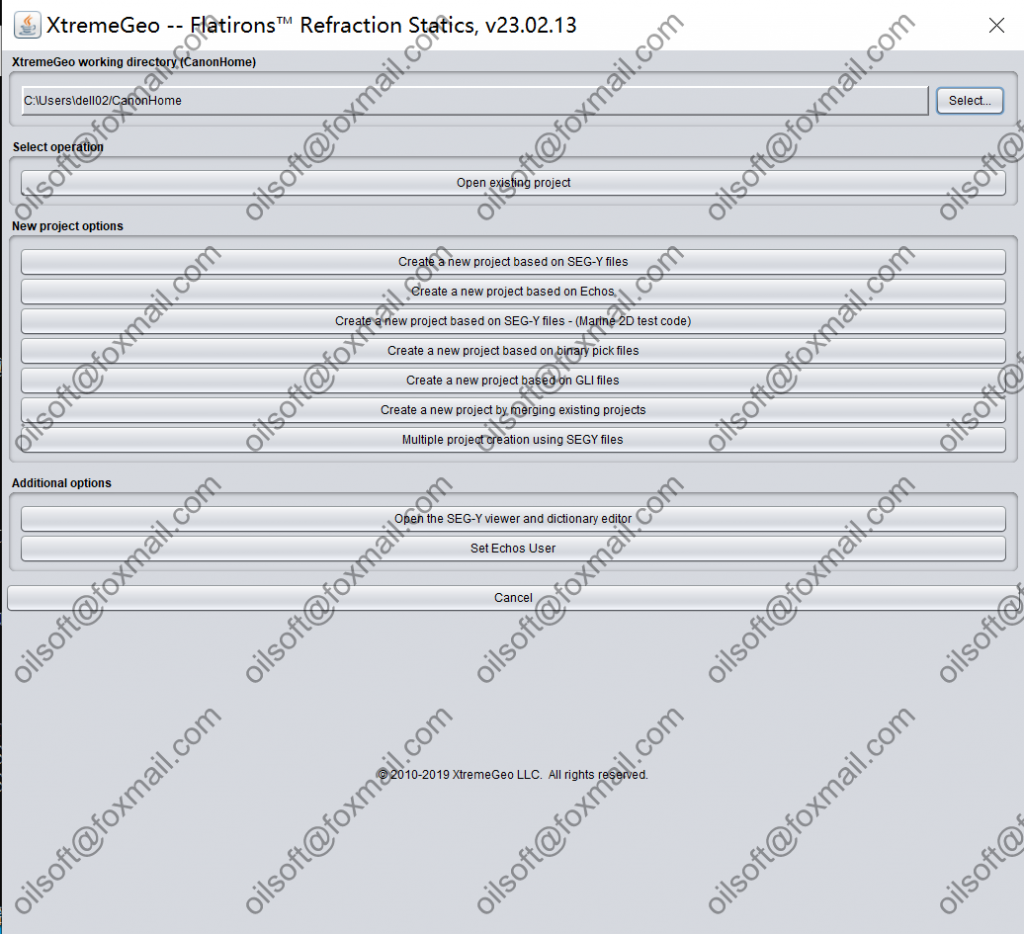
Flatirons™ Software Products

Flatirons™ software sets the standard for front end seismic data processing. Assure data processing accuracy with our integrated products:

  • Geometry QC
  • First break picking
  • Multiple methods for analyzing and modeling refraction statics
  • Eikonal tomography
  • Variable Node Spacing tomography
  • Anisotropy refraction analysis

At XtremeGeo we understand the importance of correct geometry and a reliable model of the near surface for seismic data imaging. Our intuitive software tools help you easily identify errors and analyze difficult data to correct near-subsurface distortions.

Achieve results with our advanced software tools to increase the value of all subsequent (and expensive) seismic processing steps. The multi-dimensional applications accommodate 2D, 3D and 4D data types.

Flatirons™ software implements a unique high-performance technology designed for massive datasets. Algorithms deliver 10x to 100x faster throughput than competitive applications.

Geometry Quality Control

Geometry analysis utilizes first break patterns for predicting and solving correct shot and receiver locations:

  • Import geometry from industry standard formats with pre-configured templates or ASCII import.
  • Evaluate the accuracy of the geometry with powerful visualization and statistical analysis tools.
  • Correct geometry issues that can adversely affect later seismic data processing steps.

First Break Picking and Analysis

Powerful first break picking techniques streamline this time-consuming step in the workflow without sacrificing accuracy. Automatic first break picking algorithms work in conjunction with model solutions:

  • Threshold-based picking
  • Amplitude onset
  • Pick predicting routine

Powerful manual first-break picking tools give the user complete control:

  • Multi-pane displays useful for 2D surveys
  • Common Offset / Shot / Receiver / CMP Displays

An innovative pick-less model-based approach solves difficult noisy data without manual picking.

How It Works:

  1. Set up parameters interactively and evaluate the accuracy of results instantly.
  2. Start the automatic process on the entire dataset once parameters are working well.
  3. Review statistically anomalous sections of the data volume with powerful, quick interactivity.

Statics Solutions – Refraction Methods

Flatirons™ offers multiple methods for solving near-surface modeling challenges. Each unique method has distinctive strengths to address data variability and near surface characteristics. Solve a wide range of near surface problems with a variety of approaches:

  • Delay time layer-based model
  • 3D Eikonal tomography
  • Variable Node Spacing (VNS) tomography
  • 2D-specific algorithms

Each technique provides critical interactivity to help you you make essential interpretive decisions and optimize interpretive steps. Interactive tools assist with refractor selection, weathering velocity, refractor smoothing, and statics computation and datum selection. We’ve added visualization so you can compare solutions with corrected data in multiple perspective views.You review the statics solution to quickly understand and interpret results, moving through the seismic data workflow with confidence. Designed for 2D or 3D data, this quality control includes the ability to generate CMP-stacks along any user-defined profile pulled from a 3D volume.

Eikonal Tomography

Flatirons’™ tomography technique is the most recent innovation in refraction solutions. With a powerful node-based modeling approach, the Eikonal solution delivers quick run time and accurate results.

VNS Tomography

Flatirons™ features our proprietary Variable Node Spacing (VNS) tomography, a vast improvement over existing eikonal tomography methods. VNS allows the user to use a vertically variable node spacing in order to get an increasingly finer resolution as one gets closer to the surface. We find that this is combines the benefits of finer resolution in the very near surface where velocities have much greater variance, while saving memory lower down in the model, where the velocity contrast is far less sharp.

Anisotropy Refractor Analysis

Flatirons™ uses a model-free approach to correct anisotropy regardless of origin. Whether the sine wave behavior is caused by anisotropy in refractor velocity, the layers above the refractor, by near surface geology, or a combination, the Flatirons™ technique removes the effects, insuring that subsequent processing steps are more accurate.

Exporting Results

A simple export feature easily incorporates Flatirons™ results into your seismic processing workflow. Accurate geometry and reliable near-surface estimation give you confidence that you’ve created a solid foundation to help guarantee the success of important subsequent data processing steps.

发表在 地震资料处理软件 | 标签为 , , , , | Flatirons™ Software Products已关闭评论

OpendTect 6.6.10

OpendTect软件是荷兰dGB公司研发的一个地震目标检测系统,集层序地层解释系统、倾角导向、地震颜色反演等功能为一体,可同时对多个地震属性体进行处理、可视化和解释。其中最具特色的技术是倾角导向和层序地层解释系统。
该软件利用倾角导向可直接生成导向体,导向体包含空间每一个采样点的倾角和方位角信息,在多道属性处理及滤波时利用导向体来充分考虑地质目标体的空间展布,从而提高目标体及断裂检测的精度。
此外,运用倾角导向功能还可自动追踪年代地层事件,进而进行沉积体系域解释,帮助研究人员更直观、更深刻地理解地层沉积演化过程

功能特色

OpendTect是OpenSource环境下的地震解释软件系统。它使您能够使用属性和现代可视化技术(如立体观察和体绘制)处理,可视化和解释多卷地震数据。对于更高级的工作,可以使用商业插件和免费插件。由于OpenSource结构,OpendTect也是地震解释的研究和开发环境。 OpendTect用户可以开发他们自己的解释工具作为系统的插件。 OpendTect由dGB开发和维护。 OpendTect基本主要功能:在单一调查中对2D和3D数据进行可视化和分析,Horizon跟踪器,各种属性和过滤器(包括光谱分解)的实时计算和可视化,多平台分布式计算,插件架构。商业插件包括:Dip-steering,神经网络,SSIS(层序地层解释系统),光谱蓝化等。

关于dGB地球科学B.V自1995年以来,dGB地球科学公司提供领先的地震解释软件解决方案和口译服务。我们是一家私营公司,其商业模式围绕世界唯一的开源地震解释系统OpendTect展开。 OpendTect被全球146个国家的23,000多名用户使用。我们为数千名开源用户,数千名学术用户和数百名商业用户提供服务。我们的商业用户群覆盖石油和天然气工业,地热工业,采矿和地质工程领域的所有地震解释用户。在OpendTect之上,dGB和合作伙伴开发了一系列独特的软件模块,用于从数据中提取更多的地质信息。

Release Notes of V6.6.10
OpendTect
● Fix for severe slowness in displaying 2D lines in the 3D scene
● Fix several issues within the import of ZMap data
● Fix for restoring sessions that include 2D views
● Fix for extracting faults from very large faults sets
● Fix for the problem of hidden fault planes being reset upon selecting pick-mode
● Fix enabling the ability to run the data loading training exercise without a demo
license
● The coordinate reference system is now retrieved from SEG-Y files produced by
OpendTect 6.6 release during import
● The coordinate reference system is now retrieved from SEG-Y files produced by
Petrel, providing that they are accompanied by their .crsmeta.xml file.
● It is now possible to skip the full scan of SEG-Y files when setting up a project
(although performing the full scan remains highly recommended).
● It is now possible to set the coordinate reference system directly from the “Import
SEG-Y Data” dialog when setting up a project from a SEG-Y file.
● While importing a SEG-Y file in a project which has not been setup with a CRS, one
can specify the coordinate reference system and make it the project default.
● Fix for crash in 2D SEG-Y import in batch mode
● Fix for wrong order of units in the stratigraphy manager when not using the tree view
● Fix for project selection when the data root has not been tagged as a potential data
root.
● Creating a constant Z horizon is now also available in 2D-only projects
OpendTect Pro
● Decreased the application start time when one or several license servers are not
reachable
● The license information shown in the plugin selection window was not always
accurate, especially when using the environment variable LM_LICENSE_FILE for
multiple vendors, or in the presence of expired license files next to valid license files
● Support for STL files for the import of geobodies has been added
● Large performance improvements while adding shapefiles in the basemap
● Fix for synchronization issues in the basemap for 2D lines and wells
● Fix for shapefile label displays
dGB Plugins
Dip-Steering
● Fix for running the unconformity tracker on Linux when having a 1-user license
● Create horizon from Well markers is now also available in 2D-only projects
Faults & Fractures
● Fix for running the skeletonization on Linux when having a 1-user license
HorizonCube and SSIS
● Fix for running the HorizonCube processing on Linux when having a 1-user license
Documentation
● The OpendTect training manual has been updated, especially the data loading
exercise
Security updates
● Updated the OpenSSL library to v1.1.1t
● Updated the freetype and fontconfig libraries on Linux to v2.10.4 and v2.13.1
respectively

发表在 地震资料解释软件, 正演反演软件 | 标签为 , , , , , | OpendTect 6.6.10已关闭评论

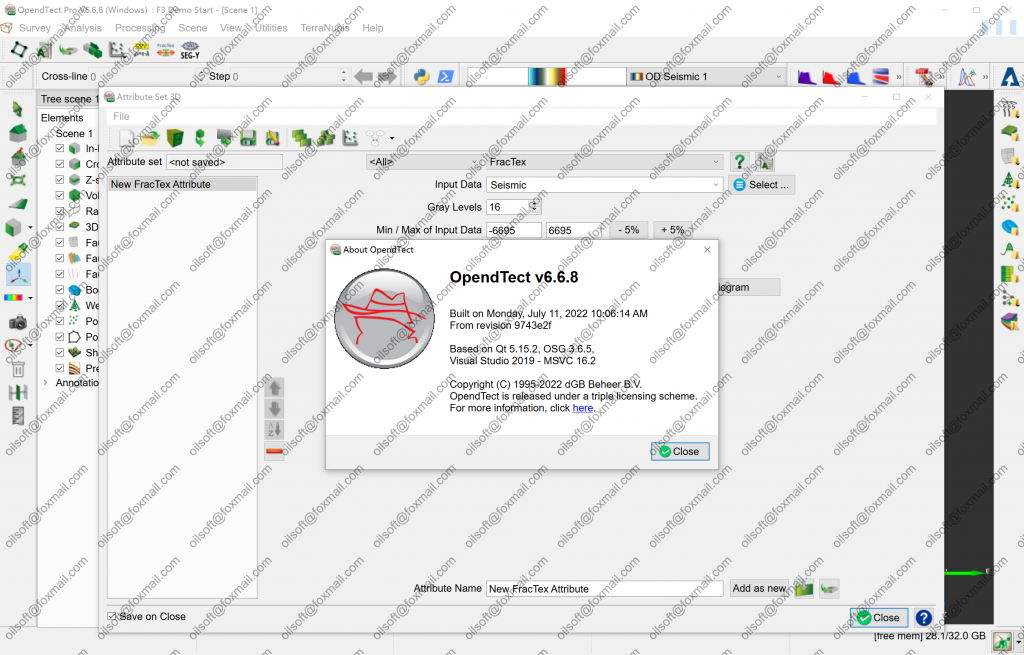
OpendTect 6.6.8

Release Notes of V6.6.8
OpendTect
● Fix for a random crash when loading 2D survey
● Fix for an occasional layout crash
● Support flattening and unflattening seismic
● Seismic processing can now flatten/unflatten datasets in batch
● Fix for MGS-Destriping icon disappearing from main scene after launching it
● Fix for a random OpendTect crash loading second SGY as attribute to Z-slice
● Fix for the OpendTect disappearing on adding second attribute via Scan SEG-Y
option
● Exporting to SEG-Y, does now write properly the (inl, crl, X, Y) to byte locations (9,
21, 73, 77) respectively
● SEG-Y inserter does not use anymore the old style import
● The time zone display has been added to host information dialog
● Fix for a random crash when trying to save an old session to the same name after a
change
● Merge seismic warn now when disk space is low
● Fix for showing an empty plugin selection window when no commercial plugins are
installed
OpendTect Pro
● Fix for an issue of all logs being displayed in Log Tool Window if one well/row is
selected in Well Table Manager
● Fix for a random issue of Basemap (re-)opening behind 3D scene when restoring
session via Basemap
● The NMO correction defaults are now set while creating synthetic PreStack gathers
in the Volume mode
● Added a new shortcut for opening Horizon Tracking Settings window
● The license checkout for permanent licences has been revised
dGB Plugins
Machine Learning
● Four new pre-trained models from Lundin GeoLab have been added to the existing
ones from dGB Earth Sciences:
○ Lundin GeoLab AJAX: Enhance S/N and bandwidth for better interpretability
○ Lundin GeoLab DeSmile: Attenuate migration artifacts and dip noise
○ Lundin GeoLab SimpleDenoise: Remove noise/jitter
○ Lundin GeoLab SimpleHmult: Attenuate flat/horizon parallel multiples
● Fix for a crash when using preloaded seismic volume during data extraction
● A View Example Sets(viewer) icon has been added to ML Example Manager
HorizonCube
● Fix for the issue of equally spaced lines created on the events in the stratal slicing
scene when extracting similarity attribute along HC
SynthRock
● Fix for a crash when closing SynthRock during async zooms between viewers
PetrelDirect
● Fix for a crash while using Petrel seismic link as input to build volume
● Fix for an issue of ML- Log-Log prediction failing to extract some of the data when
using Well linked to Petrel as input
● Fix for an issue of ML- Data extraction hanging when using seismic linked to Petrel
as input
Well Correlation Panel
● Fix for a crash when trying to uncheck displaying stratigraphy in the WCP.
Dip Steering
● Fix for the PCA Dip-Steering Algo returning erroneous values on depth data

发表在 地震资料解释软件, 正演反演软件 | 标签为 , , , , , | OpendTect 6.6.8已关闭评论

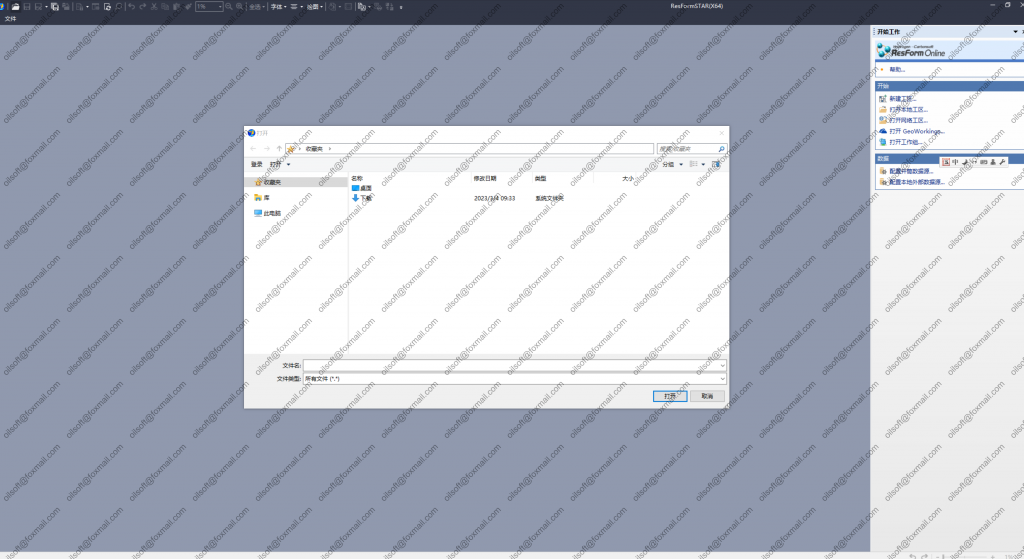
ResFormSTAR最新版2023

ResForm GeoOffice是通用性非常强的桌面工具软件,用于实现日常地质分析、研究与绘图等工作。它很好地解决了资源整合、文档兼容、地质分析与绘图以及在统一架构下构建网络应用软件等诸多技术难题。能够实现工区管理,支持本地工区、网络工区,并能直接打开或创建单井图、地层对比图、剖面图、平面图、栅状图和综合图等各种图件 ,完成这些常用图件的编绘工作;还能根据地层对比成果生成油气藏剖面图、油层栅状图、属性等值线图和油层解释数据表等;另外,还能实现各类图表的任意组合和拼接。

地质研究工作室油藏工程版软件(简称:GeoOffice R.E.)是基于ResForm构架的、通用性非常强的桌面工具软件,结合油田地质成果进行油气藏工程动态分析,综合应用油气田静态、动态、分析测试等多种资料,方便快捷地进行油气田生产状况分析和开发效果预测等工作,是油气田开发生产专业技术人员的好帮手。除可实现GeoOffice的全面功能:编绘单井图、地层对比图、剖面图、平面图等各种常用图件外,还能根据地层对比成果生成油气藏剖面图、油层栅状图、属性等值线图和对比数据表等,另外,还可进行各类油气藏工程动态分析图表的分析绘制,各类图表的任意组合和拼接还可编制“综合图” ,功能灵活而强大。


文件大小:1 dvd

下载地址:点这下载download

发表在 绘图成图, 钻井测井软件 | 标签为 , , , | ResFormSTAR最新版2023已关闭评论

密码保护:Schlumberger Techlog 2020 2021 2022

此内容受密码保护。如需查阅,请在下列字段中输入您的密码。

发表在 其它 | 标签为 | 密码保护:Schlumberger Techlog 2020 2021 2022已关闭评论

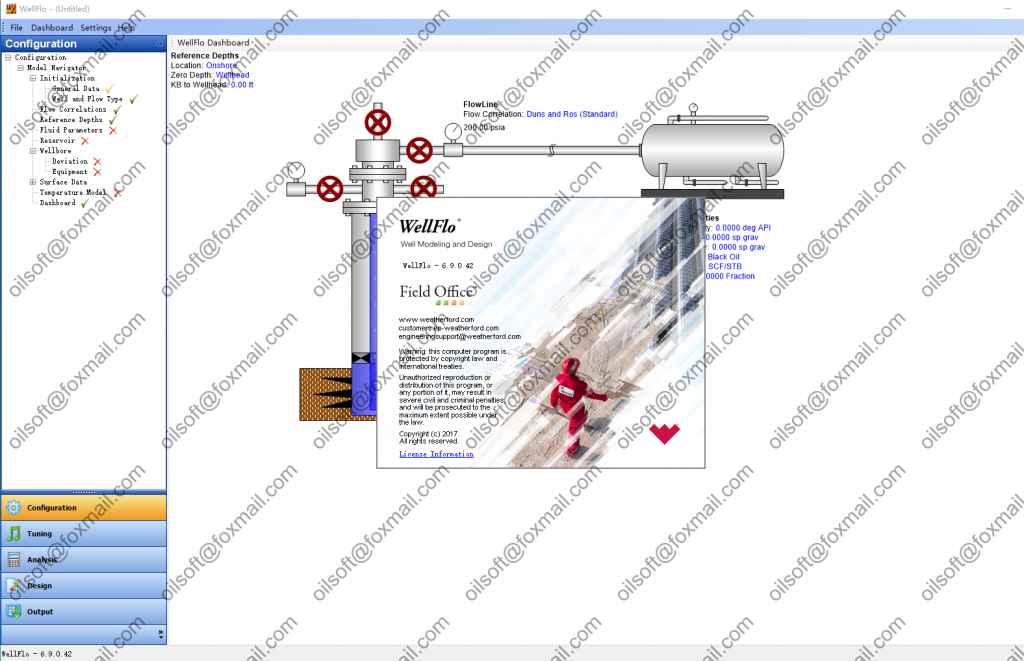
WellFlo 6.9

Weatherford.WellFlo可以分析各种设计的威尔斯:垂直、倾斜、水平。你可以计算酸、水力压裂的效果。你可以计算由于不完整的开口而产生的假表皮因素,由于射孔,由于井的倾斜,由于地层的损坏而产生的表皮系数。该程序包含一些PVT相关,流体和气体通过管道的相关性,温度计算的相关性。许多计算流入钻孔的变量都被缝上了。可以模拟各种井下设备并评估其对操作点的影响:接头、阀门、副组件。这是可能的模型离岸威尔斯与提升管。在一个程序中,您可以比较ESP、气举和喷泉。计算从WellFlo可以下载到FieldFlo,一场收集系统的设计方案。Weatherford.WellFlo软件设计和故障排除油气威尔斯建模,以及喷泉和机械化生产的成本优化方法,即这是一个全功能的电除尘器选择的可能性以及模拟器、气举设计喷泉设计。

文件大小:1 dvd

下载地址:点这下载

发表在 采油试井压裂 | 标签为 , , , | WellFlo 6.9已关闭评论

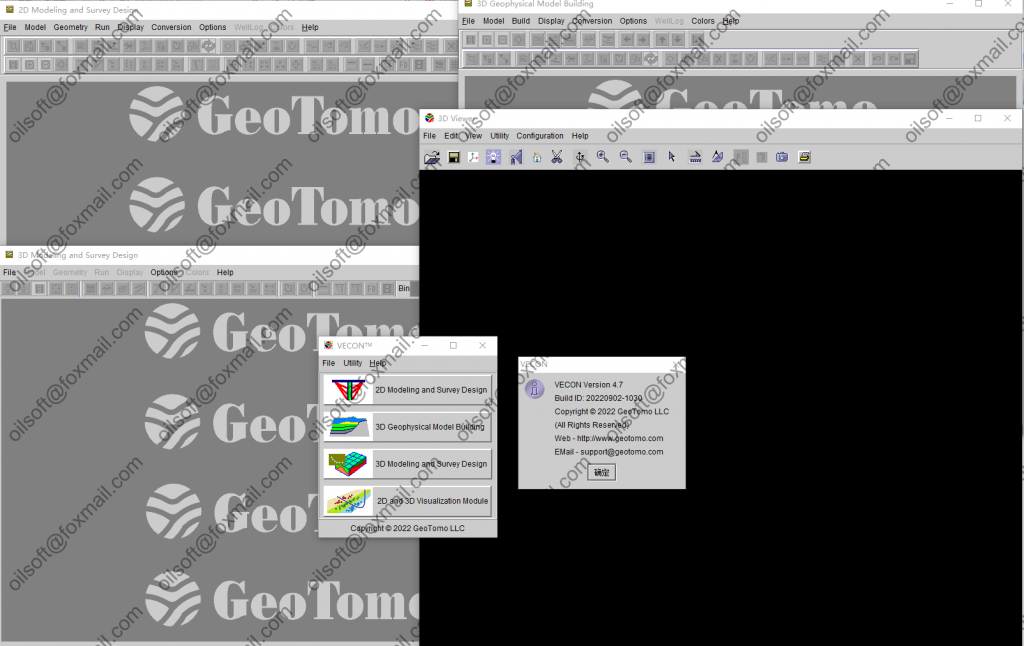
VECON 4.7 2022

GeoTomo develops and offers high-end geophysical software products and provides advanced data processing services that help geophysicists around the world to image the near-surface and subsurface in areas with rough topography, complex near-surface, and complex subsurface. These products include TomoPlus; near-surface imaging & statics solutions, GeoThrust; seismic data processing system, VECON; VSP and surface seismic modeling and survey design, MiVuTM; microseismic processing system.

VECON™ is a powerful 2D/3D VSP and surface seismic survey design and modeling system that makes completion of a variety of difficult jobs extremely efficient. Designed for any level of geoscientists, VECON features a fast, accurate, intuitive and easy-to-use toolkit for working on site, remotely through Internet, or in a workstation environment.

VECON™ imports models in a variety of other program formats and can handle arbitrary coordinates systems. Imported models geometries can be rotated to local N/S coordinates for efficient raytracing. Large reservoir models can be cropped around the area of the well or specific area of interest to reduce model size and improve performance.

size:1 dvd

download:点这下载link

文件大小:1 dvd

下载地址:点这下载

发表在 地震资料采集 | 标签为 , , , , , , | VECON 4.7 2022已关闭评论

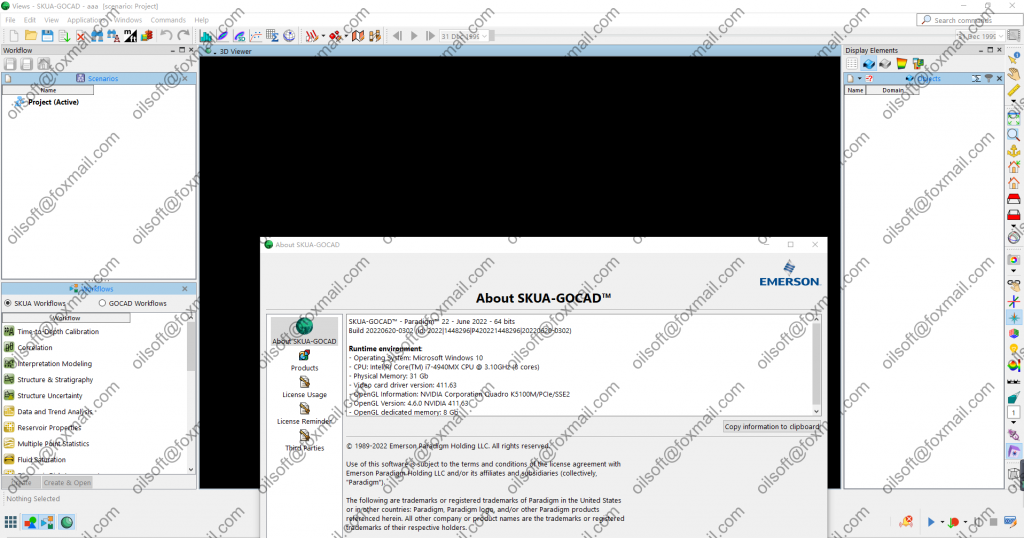
SKUA-GOCAD 2022

20 多年来,SKUA-GOCAD™ 在提供最先进的地质和储层建模功能方面一直处于行业领先地位。这种全面的产品使来自多个学科和行业的用户能够构建逼真的地下模型,以尊重地质复杂性,同时避免不必要的简化。SKUA-GOCAD 是一个高度可定制的集成产品套件,可作为独立配置或在多用户 Epos ™ 数据库上运行,以实现有效的团队协作。SKUA-GOCAD 是地质表征的巨大飞跃。地球科学家可以使用它来整合复杂的模型结构、多 z 表面和复杂的断层,例如盐丘、逆冲断层和反向断层。通过简单易用、基于工作流的界面,用户可以快速获得结果,当建模变得困难时,SKUA-GOCAD 可以处理其他解决方案无法处理的复杂性。

基于专有的 UVT  Transform ™算法,SKUA-GOCAD 将建模时间从几个月缩短到几天。所有解释结果与 Paradigm  Global Interpretation 解决方案的集成成倍地提高了地层和油藏模型的准确性,而 SKUA 流量模拟网格 为流量计算提供了最佳的油藏网格。从地震到流动模拟,Paradigm SKUA Common Earth Model 提供一致的、特定学科的地下视图。那么,地震、微震、生产、地质和趋势数据都与地球模型相结合。协作环境确保参与的每个人都可以访问对地球的完整解释,而不会进行不必要的简化。您的团队可以调查多个可追溯的场景,并创建历史数据跟踪,使他们能够通过不同的迭代追溯模型。然后,他们可以在路径上的任何地方查看和操作数据,同时创建高度准确的地下模型。

建模是勘探开发和油藏优化的核心

SKUA-GOCAD 通过以下方式弥合解释和模拟之间的差距:

  • 地震解释和储层模拟工作流程
  • 解释性结构和地质建模
  • 具有岩石特性和储层特征的模型群
  • 用于动态模拟的水库网格化/升级
  • 整合和解释所有可用来源的数据,包括熟悉的数据库和来自 OpenWorks®、ASCII、LAS 和 SEG-Y 的格式
  • 风险分析,在价值链的每一层(几何、静态和动态特性)捕获和整合不确定性的来源

SKUA-GOCAD 的好处

  • SKUA 提供通用工作空间,便于协作和数据共享
  • SKUA 模型更准确地类似于您的储层,因为没有遗漏任何数据,也没有简化解释
  • 所有解释结果与 SKUA 全球解释解决方案的集成成倍地提高了地层和储层模型的准确性
  • 通过内置数据共享、多场景处理和审计跟踪,SKUA 改进了 E&P 工作流程,减少了研究时间,并创建了业界最准确的计划和预测模型。


    文件大小:1 dvd

    下载地址:点这下载

发表在 地质建模软件 | 标签为 , , , , , | SKUA-GOCAD 2022已关闭评论

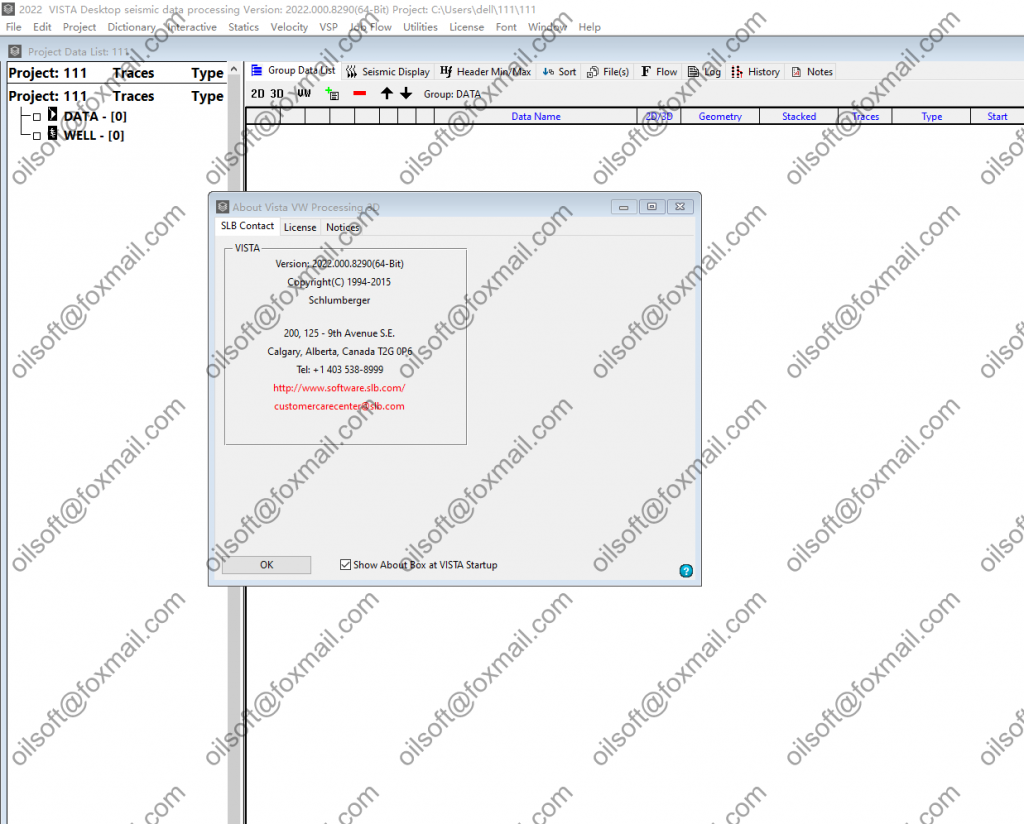
vista 2022

VISTA desktop seismic data processing software provides data processing from early-stage acquisition QC to final processing and interpretation of 2D and 3D seismic data acquired on land or offshore or as a vertical seismic profile (VSP), in all industry and manufacturer data formats.

With VISTA software, you can easily navigate workflows and seamlessly evaluate datasets using the interactive and interlinked displays. You can also add in your own algorithms through a C++ or MATLAB SDK interface.

The software supports advanced processing capabilities including AVO and angle of incidence (AVA) analysis, multicomponent processing, and 2D and 3D VSP processing.

Packages

VISTA software is available in four packages:

VISTA Field QC

The premier tool for in-field processing and QC

VISTA Field Pro

Advanced field package, including full-geometry QC and post stack migration.

VISTA Full Pro

The complete solution, from QC to pre stack migration and time-depth image analysis.

VISTA 2D or 3D VSP Pro

  • Complete VSP QC and processing for 2D and 3D VSP data.
  • 2D VSP available as a stand-alone or add-in module to VISTA Field QC, VISTA Field Pro, or VISTA Full Pro.
  • 3D VSP module available as an add-on module to VISTA Full Pro.

Advantages

  • Windows-based, single-user, portable, robust, and easy-to-learn icon-driven software
  • Interactive windows that broadcast between multiple screens for powerful QC functions
  • Interactive tools for station geometry prediction, verification, and QC
  • Programming development interface for users to add their own algorithms
  • Comprehensive header manipulation, interactive spreadsheets, and text file imports and exports
  • Surface-consistent scale, deconvolution, and statics
  • Advanced noise attenuation and signal enhancement techniques
  • Multicomponent and converted-wave QC and processing
  • Montage window for creating sophisticated output plots
  • True amplitude processing sequence
  • AVO and amplitude variation with AVA processing capabilities
  • Interactive 2D multiline tie and 3D multi survey merge
  • Pre stack and post stack time-depth migration and analysis

VISTA software is a 64-bit Microsoft Windows application with annual software releases and regular product updates. It is offered with numerous user resources including tutorials, movies, common workflows, knowledge base articles, and new feature documents.

文件大小:1 dvd

下载地址:点这下载

发表在 地震资料处理软件 | 标签为 , , , | vista 2022已关闭评论

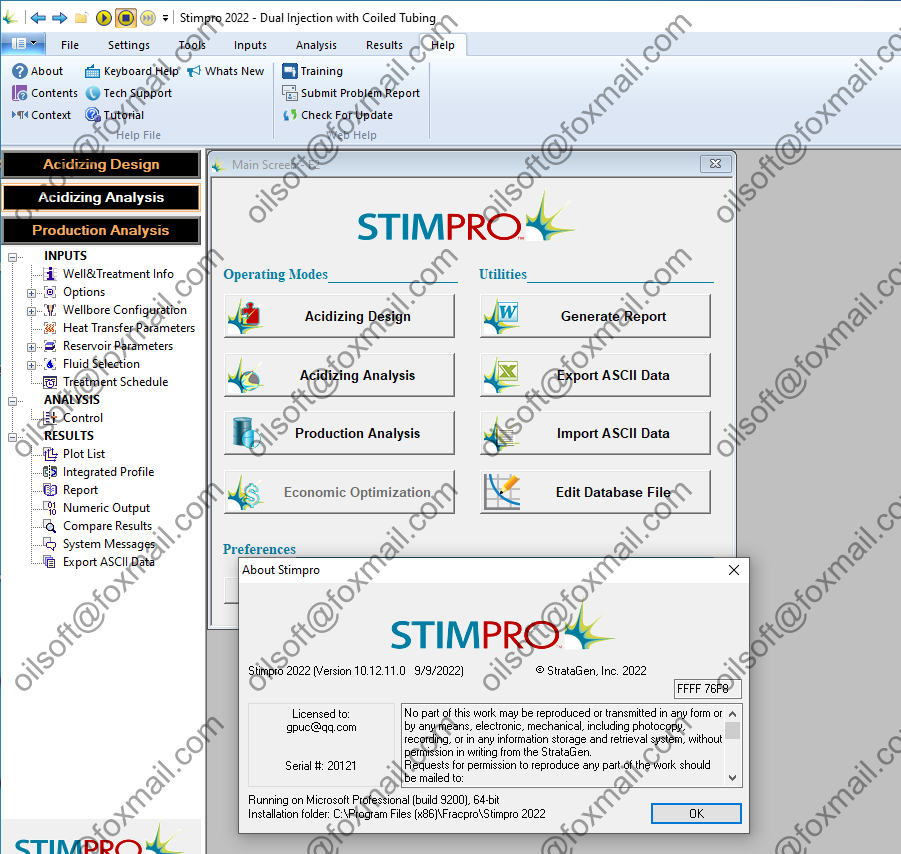
stimpro 2022

STIMPRO(即StimPT)是FRACPRO系列软件里专门针对基质酸化设计与分析的软件。作为基质酸化软件,通过内嵌完备的酸液、添加剂数据库、岩石数据库和开放的用户库,便捷的井筒结构建立通道,出色的报告生成功能等,能够完成砂岩和灰岩的酸化设计与分析。STIMPRO的一系列杰出功能,使得用户能够实现快速设计、分析与优化酸化施工。基于STIMPRO的酸化施工前、施工过程中以及施工后的系列分析,可以让用户以较少的成本,做出优质的施工设计,进而提高产能和得到理想的经济效益。

STIMPRO的适用条件及主要功能:

● 碳酸盐岩、砂岩储藏基质酸化

● 碳酸盐岩、砂岩储藏基质酸化

● 均质储藏、非均质储藏

● 直井、斜井、水平井基质酸化

● 套管射孔完井及裸眼井基质酸化

● 单级施工、多级施工

● 瞬变压力及酸化过程中的表皮系数

● 完备的岩石、酸液及添加剂数据库

● 措施井储层伤害及表皮系数描述

● 对滤饼及泡沫影响的模拟

● 对泡沫转向或固体转向的模拟

● 在线图表与报告生成功能

● ResPro产能预测、历史拟合功能

● 特有的实时分析功能使我们能灵活调整我们的酸化施工

文件大小:1 dvd

下载地址:点这下载

发表在 采油试井压裂 | 标签为 , , | stimpro 2022已关闭评论

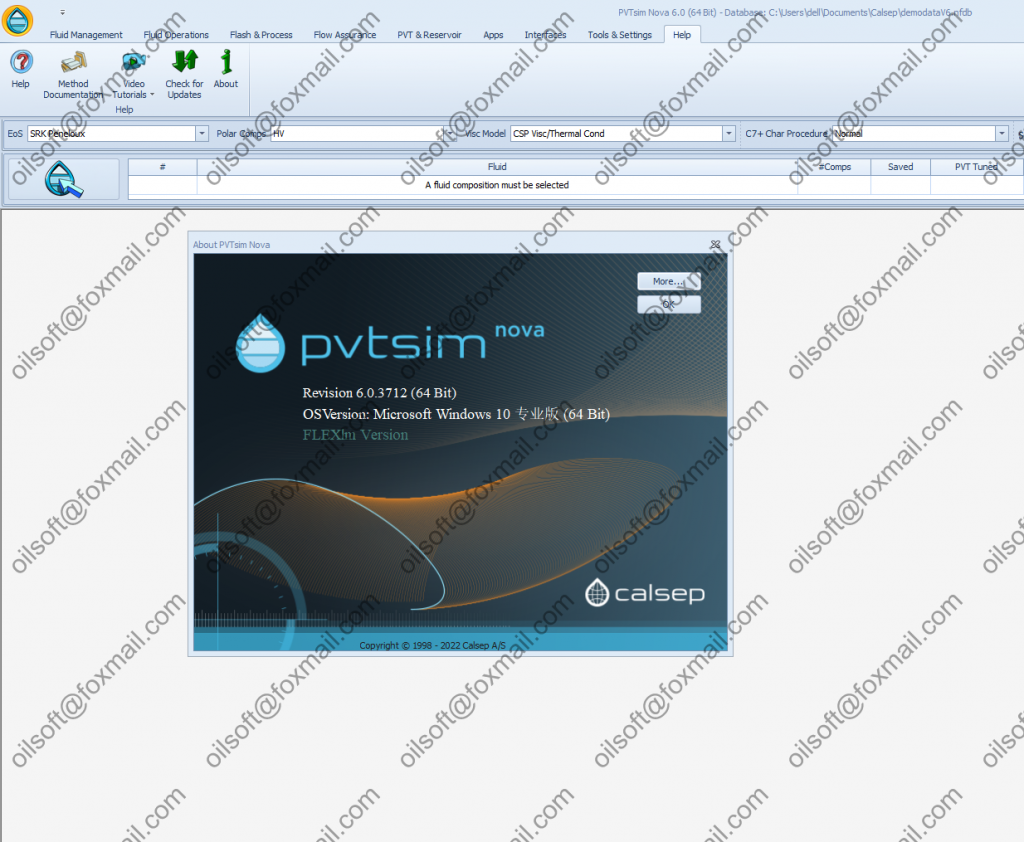
pvtsim Nova 6.0

文件大小:1 dvd

下载地址:点这下载

PVTsim is a simulation tool that works across technical disciplines. Whether you are looking for fluid properties deep in the reservoir, in the well, in a subsea pipeline or on the surface, you can rely on the predictions with PVTsim.

PVTsim Nova 5.0 to 6.0

UPDATES AND BUG FIXES

FLUID DATA

  • AUTO IMPORT OF PVT DATA FROM EXCEL SHEET
    • Automated import of PVT reports in Calsep Excel format. A PVTsim installation comes with sample Calsep Excel PVT reports.
  • PVT DATA IN PRODML XML FORMAT
    • Automated import of fluid compositions and PVT data in PRODML XML version 2.1 format.
    • Import of multiple PRODML XML files in one operation.
  • ASPHALTENE AND WAX DATA
    • New dedicated tab on Fluid View for Asphaltene  and Wax data.

FLUID MANAGEMENT

  • FLUID EXPLORER
    • Enhanced sorting features.
  • IMPORT EXTERNAL EOS MODELS
    • EoS models in the following formats can be imported: Eclipse Comp, PVTi, tNavigator Comp, Comptrack, CHC, Prosper EoS, GEM and Winprop.

FLUID HANDLING

  • USER CONTROLLED OBM CLEANING
    • New OBM cleaning option that allows the user to define the contaminated carbon number range. The impact on simulated properties of the cleaned fluid is displayed.

PVT SIMULATION & REGRESSION

  • DRY GAS CME (pVTZ)
    • CME data can be entered and regressed to for a gas with no saturation point at the experimental temperature.
  • AUTO EOS
    • The requirement of at least two classical PVT experiments no longer exists if importance assigned to the estimated mixture critical point.
  • COMMON EOS w/ PLUS REGRESSION
    • Bug corrected, which in rare cases resulted in a too low molecular weight of the heaviest pseudo-component.
  • MMP
    • Tie-line plots added.
  • CHARACTERIZED REGRESSION
    • Option to prevent negative kij’s.
  • TWO ALMOST IDENTICAL PRESSURE STAGES
    • Two differential liberation pressure stages very close to each other no longer gives an error.

RESERVOIR

  • COMPOSITION ESTIMATION MODULE
    • New module that uses the theory of chemical reaction equilibria to estimate how the composition of a reservoir fluid varies with temperature and pressure.
  • COMPOSITIONAL GRADING
    • Depth gradient option extended to possibly account for the increased compositional grading caused by viscosity effects (SPE 205887-MS).
  • FAST SLIMTUBE
    • Changed from molar-based approach to volumetric approach.

FLOW ASSURANCE

  • ASPHALTENE SCREENING TOOL
    • Outputs report that compiles De Boer plots, SARA based methods and EoS simulations for evaluating risk of asphaltene problems.
  • ASPHALTENE PHASE ENVELOPE
    • Allowed for gas condensate fluids.
  • SARA DATA
    • Can be stored in fluid database.
  • WAX DATA
    • PVTsim Nova database extended to hold wax appearance point, amount of wax in STO and amount of wax precipitation with decreasing temperature (Wax Precipitation Curve – WPC).
  • WAX TUNING
    • Wax tuning options extended to also cover data for wax precipitation with decreasing temperature (WPC).
  • HYDRATE PT CURVE
    • The Hydrate PT curve option has been updated to handle a sudden shift in hydrate temperature from the dew to bubble point side for a narrow boiling mixture.
  • EMULSION VISCOSITIES
    • Correction of oil-in-water viscosity, which was previously too low.
  • WAX VISCOSITY CALCULATIONS
    • Bug corrected to ensure that plots are always displayed correctly.

FLASH & PROCESS

  • GAS QUALITY
    • New option for calculating the NGL yield and gross heating value using either the GPA or the ISO standard.
  • MULTI FLASH WITH SOLIDS
    • New PT multi flash option that handles pure inorganic and aqueous solid phases (e.g. CO2 and ice).
  • T-BETA AND P-BETA FLASH OPTIONS
    • Enhanced robustness of T-beta and P-beta flash options for mixtures with aqueous components.
  • PT AQUEOUS FLASH
    • The Aqueous phase properties can be calculated using the Water Package and the PC-SAFT as an alternative to the selected EoS.
  • 3-PHASE SEPARATOR
    • Logic changes to have water follow the oil until the last separation stage.
  • OPEN STRUCTURE FLASH
    • Updated to always output component fugacities for all phases.
  • COPY PVT DATA
    • Input checks have been relaxed for the option to copy PVT data between fluids.

MODELS & MODEL PARAMETERS

  • MERCURY
    • Hg properties and binary interaction parameters optimized to match experimental data.
  • GERG-2008
    • Enabled in PT-aqueous flash, PT multi-phase flash, 3-phase separator in Unit Operation menu, phase envelope with water, phase mapping, critical point and in Saphir, Prosper and MBAL interfaces.
  • THERMAL CONDUCTIVITY OF AQUEOUS PHASE
    • Hydrate inhibitors taken into account when calculating the thermal conductivity of an aqueous phase.       
  • ASPHALTENE PARAMETERS
    • Cubic EoS asphaltene parameters updated (SPE 203491-MS)
  • BINARY INTERACTION PARAMETERS FOR GLYCOLS – C7+
    • Updated kij’s for pairs of a glycol (MEG, DEG or TEG) and C7+.
  • HELIUM
    • Ideal gas Cp coefficients for He have been corrected.
  • CARBON MONOXIDE
    • CO added to pure component database.

INTERFACES

  • NEW INTERFACE MODULES
    • OLGA batch option.
    • Intersect Compositional.
    • Turbulent Flux virtual meters.
    • Open Porous Media (OPM) reservoir simulator.
  • ECLIPSE BLACK OIL
    • Refined monotonicity check.
  • ECLIPSE COMP
    • Extended with option to account for the increased compositional grading caused by viscosity effects.
  • GEM
    • Updated to support T-dependent volume shift parameters.
  • HYSYS
    • C6 now appears as pseudo and et-benzene as e-Benzene in Hysys interface file.
  • IMEX
    • Corrected to ensure that undersaturated Bg-values and gas viscosities deviate from saturated values.
  • INTERSECT BLACK OIL
    • Unit specification added to interface file
  • INTERSECT COMP
    • Extended with option to account for the increased compositional grading caused by viscosity effects.
  • NEXUS COMP
    • Extended with option to account for the increased compositional grading caused by viscosity effects.
  • OLGA
    • Artificial gas phase enthalpies forced to increase with increasing temperature.
    • Bug corrected that might cause slightly inaccurate gas enthalpies for CO2-rich reservoir fluids.
  • PIPESIM
    • Incorrect values of H, S and Cp at standard conditions corrected.
  • PROSPER EOS
    • Updated to support Prosper EoS version 16 in addition to version 7.
  • tNAVIGATOR COMP
    • Extended with option to account for the increased compositional grading caused by viscosity effects.

OTHER

  • LICENSE CHECK
    • FLEXlm license check upgraded to version 11.17.
  • HIGH RESOLUTION MONITORS
    • Some menus updated for better user experience on high resolution monitors.
  • Z-FACTOR VERIFICATION REPORT
    • Updated to also cover GERG-2008.
发表在 采油试井压裂 | 标签为 , , | pvtsim Nova 6.0已关闭评论

Kingdom software SMT 2022

Kingdom 2022

Gain new insights with Dynamic Property Modeling

• Dynamic Property Modeling to more accurately and efficiently model facies and reservoir properties
• Direct Connect access to well and production data from the North American ADM
• Data management improvements in Well Explorer
• Spatial Explorer enabling collaboration between geoscientists and engineers
• Advanced 3D interpretation tools – geobodies
• Automated interpretation of faults using AI/ML – model learns as user interprets
• Expanded Workflow Builder to support additional computations
• Improved usability with project tree folders and enhanced color bar editing

Kingdom 2022 New Features

  1. Geology
  2. Spatial Explorer
  3. 3D View
  4. Geophysics
  5. Interactive Faults
  6. Usability Enhancements
  7. Direct Connect
  8. Data Management
  9. Summary and Resources
发表在 地震资料解释软件 | 标签为 , , , | Kingdom software SMT 2022已关闭评论

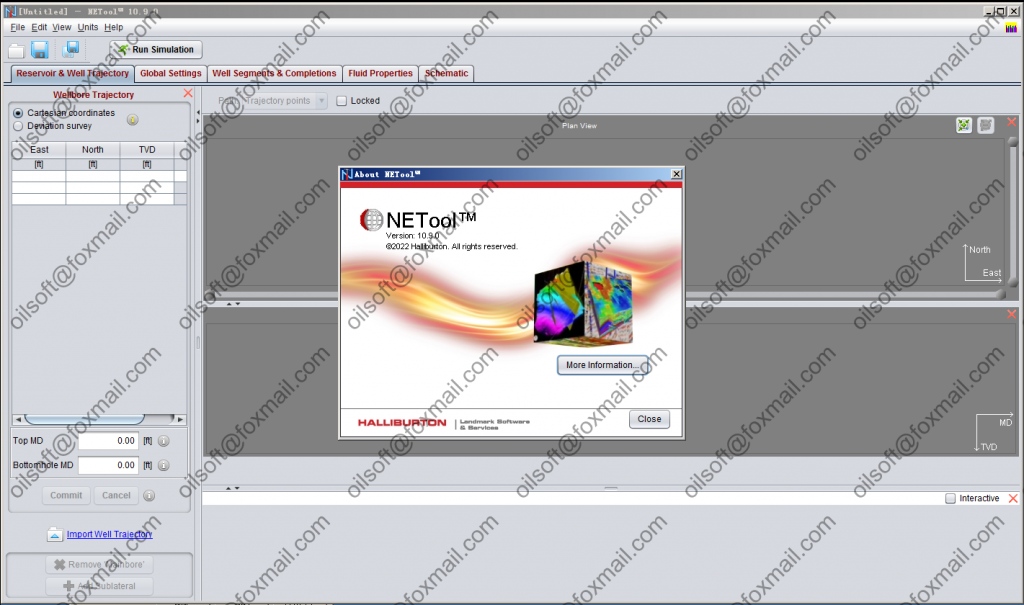
NETool 10.9

在有关完井设计和技术支撑服务中,完井团队需要根据油气藏的特性和井筒流动特性,对各种完井方式进行评价,结合生产技术指标(产能/产量)和经济指标(成本/收益/风险),选择最优的完井方式。在完井方式设计和优选过程中,包括各种复杂的模拟和计算,因此需要借助于功能齐备和模型先进的软件工具来完成。

NETool®是一款多学科信息综合应用的软件,涵盖钻井、完井、生产、油藏等技术领域,该软件将油藏流体的供应能力与不同完井方式的流动特征相结合以快速建立复杂的井筒模型,精准地模拟近井筒和井筒区域内多相流体的流动,填补了传统油藏数值模拟软件和单井井筒模拟软件之间的技术空白,使其成为油藏数值模拟和油管设计软件的桥梁,从而协助完井工程师进行完井方式设计和优选,辅助生产和油藏工程师对单井的生产情况进行实时监测,最大化油气资产价值。

功能价值:

  • 多学科、多业务的综合解决方案

NETool®可快速导入主流油藏数值模拟模型或者测井曲线数据,辅助完井工程师更准确的认识油藏中的流体流动,从而制定更为合理的完井设计方案。此外,完井工程师也可将创建的完井设计模型导出至数值模拟模型中,帮助打破负责油井设计的生产工程师和负责油井流入动态计算的油藏工程师之间的技术壁垒,实现各种完井方案整个生产周期内的效果评估,并进行长期的生产预测,为后续制定合理的工作制度奠定良好的基础。

  • 复杂的井筒与近井筒流动模拟

传统节点分析软件通常仅考虑1种环空,无法准确表征多相流体的流动,而NETool®可同时模拟4种环空,并自动处理流向问题,考虑了完井部件周围特殊流动关系,从而准确模拟流体从油藏流动至完井管串,再经过油管流动至井口。根据不同的完井设计方案计算相应的生产指标,评估新完井工具、人工举升类型或其他设备对生产的影响,从而帮助用户预测单井产能、井筒内各种风险及不合理参数,进而评估和进一步优化完井设计。

  • 先进全面的完井设计工具

根据统计,更好的完井设计方案可将采收率从3%提高到7%。NETool®可对目前所有井型及完井方式进行设计和优化,其中井型包括直井、斜井、水平井、多分支井、智能井等,特别是对于多分支井及智能完井的设计处于世界最领先水平,完井方式包括裸眼完井、割缝衬管完井、射孔完井、普通筛管完井、绕丝筛管完井、流量控制设备(ICD/AICD)、流量控制阀(ICV)等。

  • 友好直观的界面展示

在完井设计的基础上,NETool®会模拟计算全井产量(油、气、水、气油比、含水等),以及井筒内各种流动关系、井筒产量及压力剖面数据(油管和环空压力、油管和环空流速、流入环空的流量、流入油管的流量等),方便生产工程师和油藏工程师对井进行实时监测。

现场功能应用:NETool®目前广泛应用于全球油气公司和服务公司,下面列出油气公司的典型应用。

  • 完井方式优选与设计
  • 智能完井方式优选与设计
  • 油藏参数的敏感性分析优化完井设计
  • 优选井位和井身结构设计
  • 评估新的完井和钻井技术对生产的影响
  • 分析生产能力不佳的单井
  • 人工举升分析与模拟
  • 与油藏数值模拟软件耦合运算进行长期预测
  • 解决或排除生产故障
  • 单井日常生产动态监测

总之,NETool®是一款全面、智能、高效的完井设计与生产优化工具,可以帮助用户更加全面的认识油藏至复杂管串再到井口的流动,更加智能的优化完井设计,更加高效的管理单井生产制度。


发表在 采油试井压裂 | 标签为 , , , , | NETool 10.9已关闭评论

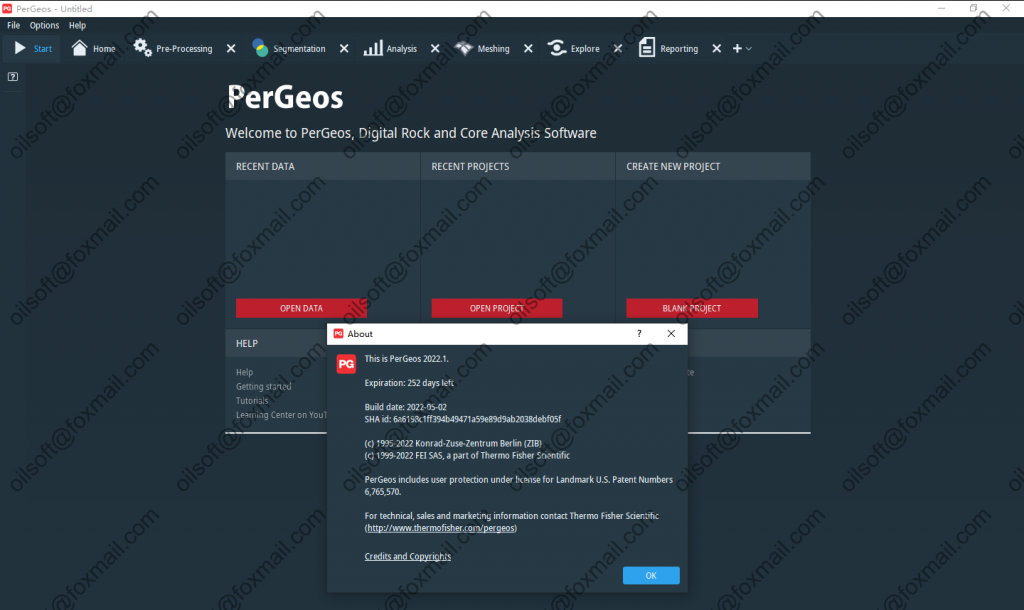
PerGeos 2022


Pergeos Software是科学和工业数据领先的高性能3D可视化和分析解决方案。 无论何处需要处理3D成像数据集,Amira-Avizo和Pergeos软件都能在直观的工作流程和易于使用的图形界面中提供丰富的最先进的图像数据处理,探索和分析功能。

无论在哪里需要处理和管理成像数据集,Thermo Scientific 软件解决方案都能提供最先进的图像数据处理、探索和分析功能。 我们专用于生命科学、材料科学和数字岩石分析的适应性软件包会定期发展。 与科学专家共同开发的新功能、改进和新 Xtras 提供了一流的分析软件解决方案,可根据您的需求量身定制。

Amira Software、Avizo Software 和 PerGeos Software 2022 版推出了激动人心的新工具和增强功能。

发表在 其它 | 标签为 , , | PerGeos 2022已关闭评论