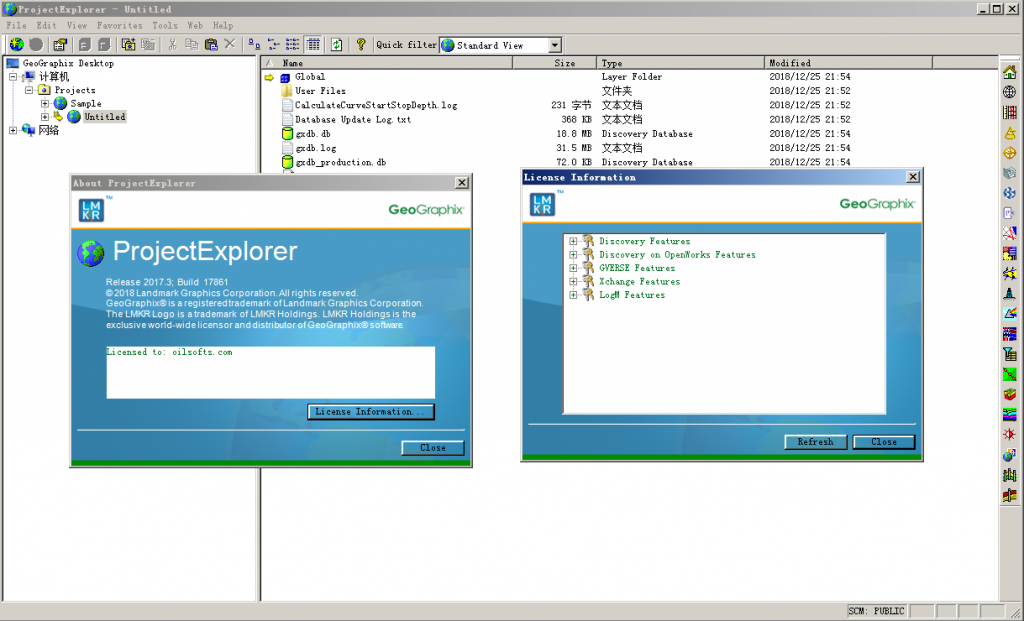
The following is a summary of the new features added to GeoGraphix Release 2017.3.
Architecture
ESRI ArcGIS Runtime Engine 10.5.1
ESRI ArcGIS Runtime Engine 10.5.1 is supported in this release.
Advanced Database Security
All users are now logged into the database using their active directory credentials instead of the default user ID and password. This enables you to trace transactions performed on the database for auditing purposes.
Microsoft Office 2016
Support for Microsoft Office 2016 (32-bit and 64-bit) is added.
GVERSE Geophysics
Tighter Integration
Create cross sections in GVERSE Geomodeling and smartSECTION with a single click.
Open wells in WellBase, PRIZM, ZoneManager, Depth Registration, and LogM Well Editor directly from the 3D module.
Send seismic sections displayed in 3D view to vertical and horizontal seismic display windows and work with sections in a 2D view.
View seismic sections displayed in 2D windows immediately in the 3D view.
Access to interpretation, survey and section derived trace scaling options in 3D.
Apply customized PALX format color palette to seismic sections, horizon surfaces and more in the main GVERSE Geophysics interface.
Enhanced Interpretation Capabilities
Quickly pick horizons even through noisy data with a new 2D auto pick algorithm.
Snap horizons more accurately with additional options to snap to events above, below or near existing picks.
Gain more insight into stratigraphic features by flattening the entire 3D scene on a horizon.
Independent action lists for individual horizons and faults for more flexible and context aware undo and redo functionality.
Easily verify well-seismic tie using a variable density display for synthetic seismograms.
Increased Visualization Functionality
Add mapping grids to the 3D scene and map of the new 3D module.
View horizon picks associated with mapping grids in the 3D scene.
Gain more insight into your structures by drawing ISOMap layers directly on the horizon surface.
Improved Efficiency and Usability
Access all depth conversion settings in a single location.
Shortcuts to depth conversion workflows in the 3D view.
Scene-specific toolbars for a true multiscreen experience.
Hotkeys for arbline and probe face navigation
Quicker access to partial transparency options in the color palette control.
Single click to open seismic sections at well locations and horizon and fault surfaces.
View well symbols as defined by the status field in WellBase in the 3D scene.
Manipulate and modify arbitrary lines directly in the 3D scene.
Note: For the purpose of this documentation only, the term SeisVision refers to the GVERSE Geophysics Main Interface and vice versa.
smartSECTION/GVERSE Geomodeling
Easy to use Graphical User Interface
Application window is redesigned for better usability and user experience, with improved docking support and ribbon controls.
Fault Aliasing in 3D View
Using the tools available in the Fault Aliasing Toolbar, alias unassigned faults to named faults by identifying their relationship in 3D View.
Microseismic Display
Use the Microseismic Timeline feature in 3D View to analyze hydraulic fracturing stages, pressures, slurry and proppant characteristics, and corresponding seismic events in the treatment well.
Picking Options Toolbar
Use the Picking Options Toolbar to add, remove, or modify surface tops and fault cuts on wells in the 3D View.
Add/Remove Wells from Geomodel
Ability to add/remove wells from the geomodel without changing the interpretation settings.
Calculate Wells Length and Percent in Zone
Determine the length and percentage of the drilling wells within a target zone and save the calculations in ZoneManager or export the details as an ASCII file.
Batch Update
Batch Update mode is no longer manual and stays enabled by default. In previous releases, there was an option to switch Batch Update mode on/off, which is replaced by making this feature permanently enabled so you can continue working with the GSM tools for better performance.
Cursor Tracking in all views
You can now track the cursor position in all three views. With this feature on, a crosshair displays in the 3D View that corresponds to the position of the cursor on the active cross section in the Cross Section View, and on the line of section in the Map View.
Improved Cross Sections List in Data Panel 3D
The list of all cross sections is available in Data Panel 3D where you can differentiate between open and closed Cross Sections or Fences with the help of cross section icon displayed next to open cross sections or fences.
Cross Section Well Groups
All wells existing in a cross section are automatically grouped into a well group which is listed under the Cross Sections node in Data Panel 3D. This allows for better usability and for applying desired properties specifically to the wells of a particular cross section.
PRIZM
Improved Single Well Export
Select the desired curves from multiple curve sets and export the curves to a single LAS or CSV file over any specific zone, formation interval, or depth range.
Multi-colored Multi-well Cross Plot
Display multi-well clusters in different colors to easily differentiate between the data points belonging of different wells and analyze petrophysical behavior of the wells.
ASCII Export
Export the curve values in a text file using tab, space, or comma as a field separator.
Crossplot Data Points Export
Export the selected well data points from a crossplot to a CSV file.
View Multi-well Crossplot Wells in other GGX Applications
Select a group of points in a Multi-well crossplot and open the corresponding wells in WellBase, GeoAtlas, smartSECTION, GVERSE Geomodeling, and ZoneManager.
Import/Export Curves List and Curves Aliases
Import and export the default curves list and their associated curve aliases by using the options available in the Default Curves tab of the Project Default Settings dialog.
Decimal Representation of Curve Depth Values
Using the Data Readout mode, increase or decrease the decimal places in the curve depth values. The depth values in the curve insert area display up to three decimal places by default and can now be increased to six decimal places.
Z-Axis Color Spectrum
Get more control over the Z-axis color bar by adding more segments and colors. Enter any number between 1 to 30 for segmented intervals for color and scales on the crossplots.
CDS Template
Save the Curve Data Statistics template with the desired parameters set in the Curve Data Statistics dialog box. The saved template in the project directory can be used again with the Load Template option.
Customized WellBase Filters
Use customized WellBase filters to quickly locate the desired well for core, deviation, and dipmeter data import.
Choose and Rename Curves During Import
Ability to select specific curve(s) from the LAS file to import into the database and rename it to a new curve name during a manual import operation.
Save PRIZM Sessions
Save PRIZM sessions, including display windows, templates, report windows, Data Interval, Display Interval (log and crossplot only), Interpretation Set, and UDE states to an interpretation file that can be restored at a later time.
DepthRegistration
Display Formation Tops on Straightened Images
From the Select Formation Tops dialog box, select the formation tops you want to display on raster images. The selected formation tops are listed in the Registered Images pane on the left and are also marked on the registered straightened image pane. Once the formations are selected, the Formation Tops button in the standard toolbar can then be used as a toggle to show or hide the formation tops marked on the Straightened Images.
Support for RasCalML (XML) v2.2
Added the support for RasCalML (XML) v2.2 for DepthRegistration data imports.
GVERSE Field Planner
A one of a kind, fully automated field planning solution for Oil and Gas exploration. Unlike manual field planning functionality, GVERSE field planning introduces the planning and management of wells right within GeoGraphix. Plan wells pad by pad or guide GVERSE Field Planner to automatically position wells by defining hazards. Define surface hazards to avoid high sloped areas, rivers, existing pads, and custom restricted areas by specifying shape files. Define subsurface hazards to avoid wells that have already been drilled in the area, add tracts and setbacks to the owned leases with Lease Planner and GVERSE Field Planner, all integrated in the field planning workflow, to automatically provide, for your field, the most optimum, highest lateral length scenario in minutes.
Surface and Subsurface Hazards
Use surface and subsurface hazards as shapefiles in GVERSE field planning to avoid high sloped areas, rivers, existing pads, custom restricted areas, and existing wells already drilled in the area for the most optimized field plan.
DEM as Surface Hazards Shapefile
Use DEM (Digital Elevation Model) as a surface hazard file through auto field planning. Calculate the gradient of the grids on DEM layer. With the gradient higher than a user-selected number, the area automatically becomes a hazard zone.
Plan Wells Simultaneously in Multiple Drilling Windows
Specify multiple drilling windows as shapefiles in one field and have GVERSE Planner generate optimally spaced wells. ItвҖҷs possible to provide custom azimuths to each drilling window.
Create Wells Deviation Surveys
Automatically create deviation surveys using the create wells deviation surveys feature in GVERSE Field Planner option via GVERSE Planner.
Lease Planner
Custom Azimuths for Lease Blocks
Set custom azimuths for different lease blocks and tracts. Azimuth for one or multiple tracts can be set and modified simultaneously for certain drilling windows.
Build Internal Setbacks
Add internal setbacks while adding multiple tracts in a selected lease area.
GeoAtlas
Create Surface and Subsurface Hazards Layers
Create surface and subsurface hazards layers as shapefiles in GeoAtlas to avoid high sloped areas, rivers, existing pads, custom restricted areas, and existing wells already drilled in the area.
Access FTP Hyperlinks in ESRI Shapefiles
Access FTP hyperlinks imported in ESRI shapefiles via data attributes in GeoAtlas.
GVERSE Inversion
Absolute impedance is supported.

